ICBM 152 Nonlinear atlases (2009)

mni_icbm152_sym_09c_small

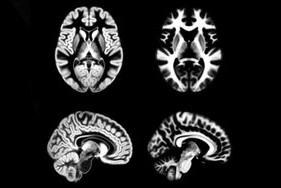
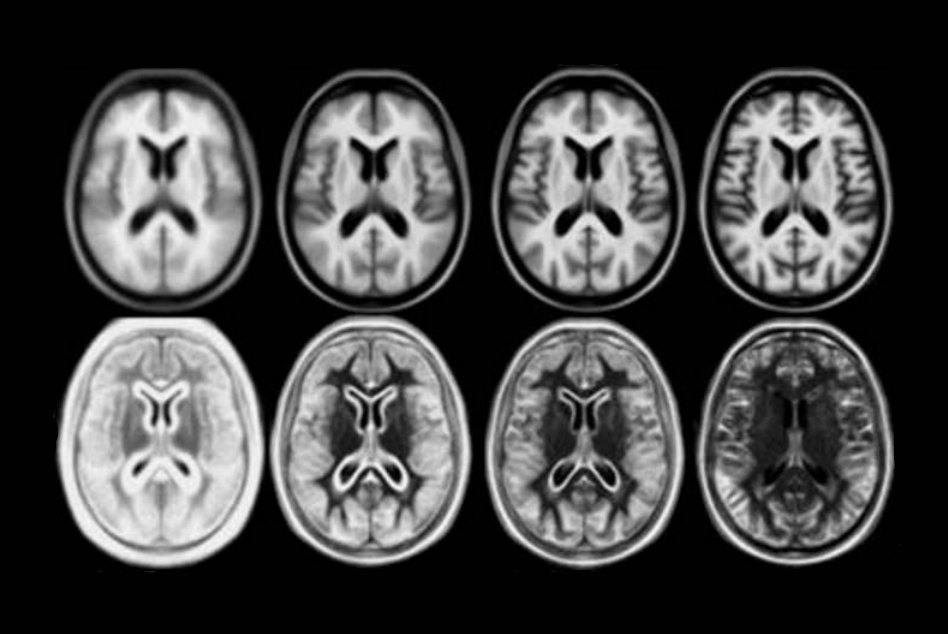
A number of unbiased non-linear averages of the MNI152 database have been generated that combines the attractions of both high-spatial resolution and signal-to-noise while not being subject to the vagaries of any single brain (Fonov et al., 2011). The procedure involved multiple iterations of a process where, at each iteration, individual native MRIs were non-linearly fitted to the average template from the previous iteration, beginning with the MNI152 linear template.

We present an unbiased standard magnetic resonance imaging template brain volume for normal population. These volumes were created using data from ICBM project.

6 different templates are available:

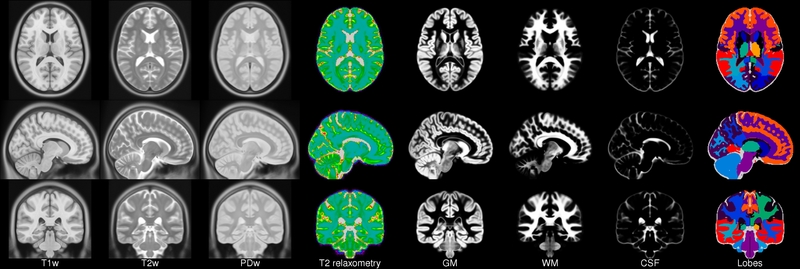
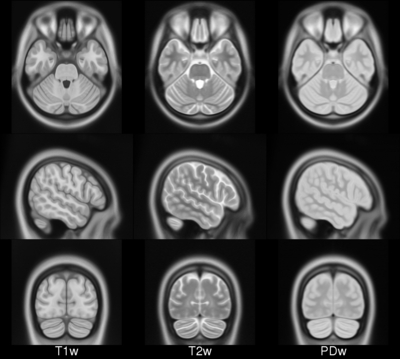
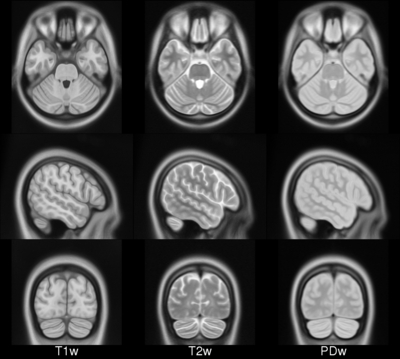
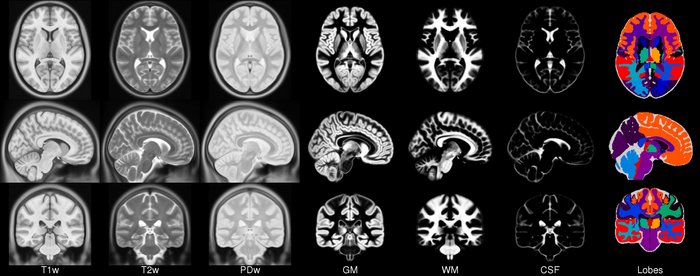
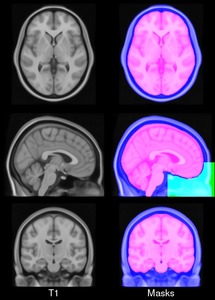
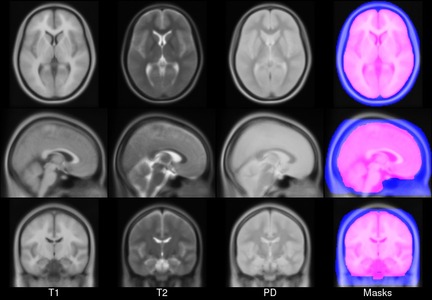
  • ICBM 2009a Nonlinear Symmetric – 1×1x1mm template which includes T1w,T2w,PDw modalities, also T2 relaxometry (T2 values calculated for each subject using single dual echo PD/T2 scan), and tissue probabilities maps. Also included lobe atlas used for ANIMAL+INSECT segmentation, brain mask, eye mask and face mask. Intensity inhomogeneity was performed using N3 version 1.10.1.
  • ICBM 2009a Nonlinear Asymmetric template – 1×1x1mm template which includes T1w,T2w,PDw modalities, and tissue probabilities maps. Intensity inhomogeneity was performed using N3 version 1.10.1. Also included brain mask, eye mask and face mask.
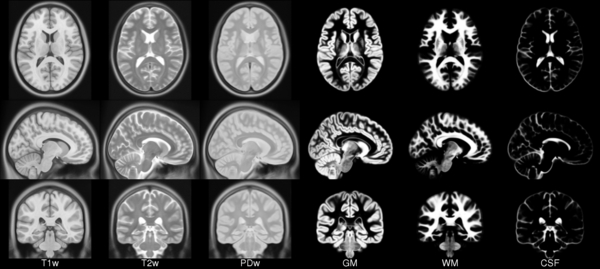
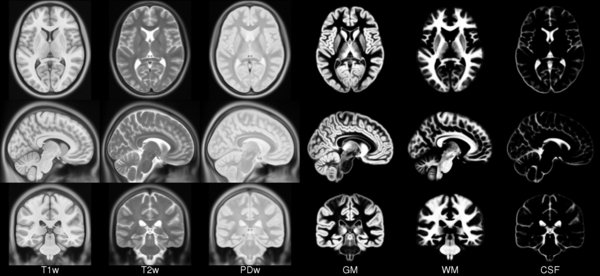
  • ICBM 2009b Nonlinear Symmetric – 0.5×0.5×0.5mm template which includes only T1w,T2w and PDw modalities.
  • ICBM 2009b Nonlinear Asymmetric – 0.5×0.5×0.5mm template which includes only T1w,T2w and PDw modalities.
  • ICBM 2009c Nonlinear Symmetric – 1×1x1mm template which includes T1w,T2w,PDw modalities, and tissue probabilities maps. Also included lobe atlas used for ANIMAL+INSECT segmentation, brain mask, eye mask and face mask. Intensity inhomogeneity was performed using N3 version 1.11. Sampling is different from 2009a template.
  • ICBM 2009c Nonlinear Asymmetric template – 1×1x1mm template which includes T1w,T2w,PDw modalities, and tissue probabilities maps. Intensity inhomogeneity was performed using N3 version 1.11 Also included brain mask, eye mask and face mask.Sampling is different from 2009a template.

All templates are describing the same anatomy, but sampling and or pre-processing is different: different versions of N3 algorithm produces slightly different tissue probability maps. Tools for using these atlases can be found in the Software section.

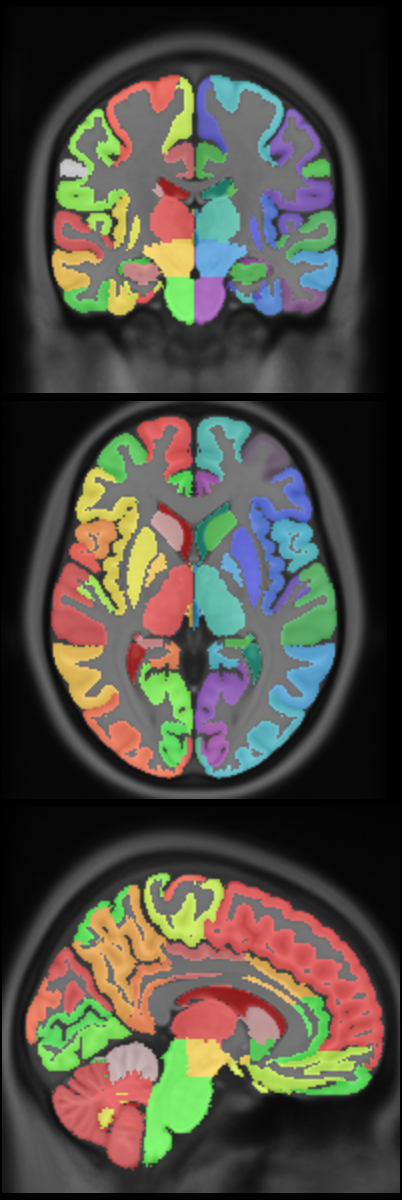
 New: CerebrA: Mindboggle atlas adapted for ICBM 2009c template

  • CerebrA labels are based on an accurate non-linear registration of cortical and subcortical labelling from Mindboggle 101 to the symmetric ICBM 2009c atlas, followed by manual editing.

Viewing
Viewing the multiple atlas volumes online requires Java browser support. The Java Internet Viewer (JIV2) used here is available for download and personal use under the GNU general public license (GPL). To view the ICBM 2009 atlases online Click “View with JIV” links below. The MNI stereotaxic coordinates (X,Y,Z) are displayed in the first row below the volumes.

For viewing, one can use the left most mouse button to click on any image, and the other cross-sectional images will be updated with the appropriate position. You can also hold the middle/rocker mouse button down while moving up or down, to pan through the image plane. Holding ‘Shift’ with the left or middle button will enable dragging and zooming.

When looking at the images, remember that left is left and right is right!

 
Methods
Image pre-processing included non-uniform intensity correction (Sled, 1998) and intensity normalization to a range of 0–100. All T1w MRI data was then transformed into the Talairach-like MNI stereotaxic space using minctracc (Collins, Neelin et al. 1994). Brain masking was performed using BET (Smith, 2002). Age-based subgroups of subjects were created, and all scans within each group were then automatically re-registered to the stereotaxic space using the appropriate template. For each group, an iterative nonlinear co-registration algorithm (Grabner, Janke et al. 2006, Fonov, 2011), was applied to obtain the group averages. The T1-based transformation was then applied to the T2, PD and tissue classified volumes to generate average atlases for these data. Methodological details can be found in (Fonov, 2011).  
 
Anatomical Structures Segmentation
All necessary files are distributed with MINC1 and MINC2 versions of the 2009a and 2009c templates, use lobe_segment.pl script, it is also distributed as part of Minc Tool Kit

Software used to create average anatomical templates is available at Github, numerical identifiers of structures are explained in icbm2009_lobe_defs.txt

Demographics (same as ICBM152_linear)

  • Handedness was scored on a scale of 0-10.  Average(std dev) for 141 of the 152 subjects was 8.57(2.50) with a range of 1-10 and interquartile range 8-10.
  • Age, measured in years:  25.02(4.90)y, range 18-44y, interquartile range 21-28y
  • 86 males and 66 females
  • Ethnic background: 129 caucasian, 15 asian and 1 mixed decent

Publications

The following publications should be referenced when using this atlas:
  1. VS Fonov, AC Evans, K Botteron, CR Almli, RC McKinstry, DL Collins and BDCG, Unbiased average age-appropriate atlases for pediatric studies, NeuroImage,Volume 54, Issue 1, January 2011, ISSN 1053–8119, DOI: 10.1016/j.neuroimage.2010.07.033
  2. VS Fonov, AC Evans, RC McKinstry, CR Almli and DL Collins, Unbiased nonlinear average age-appropriate brain templates from birth to adulthood, NeuroImage, Volume 47, Supplement 1, July 2009, Page S102 Organization for Human Brain Mapping 2009 Annual Meeting, DOI: https://dx.doi.org/10.1016/S1053-8119(09)70884-5

Anatomical Structures Segmentation

  1. DL Collins, AP Zijdenbos, WFC Baaré and AC Evans, ANIMAL+INSECT: Improved Cortical Structure Segmentation,IPMI Lecture Notes in Computer Science, 1999, Volume 1613/1999, 210–223, DOI: https://dx.doi.org/10.1007/3-540-48714-X_16
CerebrA: Mindboggle atlas adapted for ICBM 2009c template
  1. AL Manera; M Dadar, VS Fonov, DL Collins, CerebrA: Accurate registration and manual label correction of the Mindboggle 101 atlas for the MNI-ICBM152 template. In press
License
Copyright (C) 1993–2004 Louis Collins, McConnell Brain Imaging Centre, Montreal Neurological Institute, McGill University. Permission to use, copy, modify, and distribute this software and its documentation for any purpose and without fee is hereby granted, provided that the above copyright notice appear in all copies. The authors and McGill University make no representations about the suitability of this software for any purpose. It is provided “as is” without express or implied warranty. The authors are not responsible for any data loss, equipment damage, property loss, or injury to subjects or patients resulting from the use or misuse of this software package.
Download
ICBM 2009a Nonlinear Symmetric
1×1x1mm template: MINC2 72MB MINC1 75MB NIFTI 56MB View with JIV
mni_icbm152_sym_09a_small
ICBM 2009a Nonlinear Asymmetric
1×1x1mm template: MINC2 58MB MINC1 58MB NIFTI 57MB
mni_icbm152_asym_09a_small
ICBM 2009b Nonlinear Symmetric
0.5×0.5×0.5mm template:MINC2 357MB MINC1 358MB NIFTI 348MB
mni_icbm152_sym_09b_small
ICBM 2009b Nonlinear Asymmetric
0.5×0.5×0.5mm template: MINC2 366MB MINC1 367MB NIFTI 358MB
mni_icbm152_asym_09b_small
ICBM 2009c Nonlinear Symmetric
1×1x1mm template: MINC2 57MB MINC1 57MB NIFTI 55MB View with JIV
mni_icbm152_sym_09c_small
ICBM 2009c Nonlinear Asymmetric
1×1x1mm template: MINC2 57MB MINC1 57MB NIFTI 57MB
mni_icbm152_asym_09c_small
CerebrA atlas
MINC2 MINC1 NIFTI
mni_icbm152_nlin_sym_09c_CerebrA
Contact
For questions related to the MNI ICBM 2009 atlases (rather than the website), contact Vladimir Fonov

MNI ICBM152 non-linear

MNI ICBM 152 non-linear 6th Generation Symmetric Average Brain Stereotaxic Registration Model

This is a version of the ICBM Average Brain – an average of 152 T1-weighted MRI scans, linearly and non-linearly (6 iterations) transformed to form a symmetric model in Talairach space – that is specially adapted for use with the MNI Linear Registration Package (mni_autoreg).

Publications

  1. G. Grabner, A. L. Janke, M. M. Budge, D. Smith, J. Pruessner, and D. L. Collins, “Symmetric atlasing and model based segmentation: an application to the hippocampus in older adults”, Med Image Comput Comput Assist Interv Int Conf Med Image Comput Comput Assist Interv, vol. 9, pp. 58–66, 2006. https://dx.doi.org/10.1007/11866763_8

License
Copyright (C) 1993–2009 Louis Collins, McConnell Brain Imaging Centre, Montreal Neurological Institute, McGill University. Permission to use, copy, modify, and distribute this software and its documentation for any purpose and without fee is hereby granted, provided that the above copyright notice appear in all copies. The authors and McGill University make no representations about the suitability of this software for any purpose. It is provided “as is” without express or implied warranty. The authors are not responsible for any data loss, equipment damage, property loss, or injury to subjects or patients resulting from the use or misuse of this software package.

Download
Download archives containing average t1w model, brain mask, head mask and eye mask: MINC1 11MB MINC2 11MB NIFTI 13MB

Linear ICBM Average Brain (ICBM152) Stereotaxic Registration Model

mni_icbm152_lin
This is a version of the ICBM Average Brain – an average of 152 T1-weighted MRI scans, linearly transformed to Talairach space – that is specially adapted for use with the MNI Linear Registration Package (mni_autoreg).

Methods

In 2001, within the ICBM project (Mazziotta et al., 1995, 2001a,b), three sites (MNI, UCLA, UTHSCSA) each collected ~150 MRI volume images from a normative young adult population. These images were acquired at a higher resolution than the MNI305 data and exhibited improved contrast. To create MNI152, each individual in the MNI cohort was linearly registered to MNI305. This new template exhibits better contrast and better definition of the top of the brain and the bottom of the cerebellum due to the increased cover- age during acquisition.

Demographics

  • Handedness was scored on a scale of 0-10.  Average(std dev) for 141 of the 152 subjects was 8.57(2.50) with a range of 1-10 and interquartile range 8-10.
  • Age, measured in years:  25.02(4.90)y, range 18-44y, interquartile range 21-28y
  • 86 males and 66 females
  • Ethnic background: 129 caucasian, 15 asian and 1 mixed decent

Publications

Mazziotta, J.C., Toga, A.W., Evans, A.C., Fox, P., Lancaster, J., 1995. A probabilistic atlas of the human brain: theory and rationale for its development. NeuroImage 2, 89–101. Mazziotta, J.A., Toga, A.W.,

Evans, A.C., Fox, P.T., Lancaster, J., Zilles, K., Woods, R., Paus, T., Simpson, G., Pike, B., Holmes, C., Collins, D.L., Thompson, P., MacDonald, D., Iacoboni, M., Schormann, T., Amunts, K., Palomero-Gallagher, N., Geyer, S., Parsons, L., Narr, K., Kabani, N., LeGoualher, G., Boomsma, D., Cannon, T., Kawashima, R., Mazoyer, B., 2001a. A probabilistic atlas and reference system for the human brain: International Consortium for Brain Mapping (ICBM). Philos. Trans. R. Soc. London B Biol. Sci. 356, 1293–1322.

Mazziotta, J.C., Toga, A.W., Evans, A.C., Fox, P.T., Lancaster, J., Zilles, K., Woods, R., Paus, T., Simpson, G., Pike, B., Holmes, C.J., Collins, D.L., Thompson, P., MacDonald, D., Iacoboni, M., Schormann, T., Amunts, K., Palomero-Gallagher, N., Geyer, S., Parson, L., Narr, K., Kabani, N., LeGoualher, G., Boomsma, D., Cannon, T., Kawashima, R., Mazoyer, B., International Consortium for Brain Mapping, 2001b. Four-dimensional probabilistic atlas of the human brain. J. Am. Med. Inform. Assoc. (JAMIA) 8 (5), 401–430 https://www.loni.ucla.edu/ICBM/Downloads/Downloads_ICBMtemplate. shtml.

License

Copyright (C) 1993–2009 Louis Collins, McConnell Brain Imaging Centre, Montreal Neurological Institute, McGill University. Permission to use, copy, modify, and distribute this software and its documentation for any purpose and without fee is hereby granted, provided that the above copyright notice appear in all copies. The authors and McGill University make no representations about the suitability of this software for any purpose. It is provided “as is” without express or implied warranty. The authors are not responsible for any data loss, equipment damage, property loss, or injury to subjects or patients resulting from the use or misuse of this software package.

Download

Download archives containing average t1w,t2w and pdw model, brain mask and head mask: MINC1 30MB MINC2 30MB NIFTI 41MB

BITE: Brain Images of Tumors for Evaluation database

Overview

The goal of this database is to share in vivo medical images of patients wtith brain tumors to facilitate the development and validation of new image processing algorithms.

Pre- and post-operative MR, and intra-operative ultrasound images have been acquired from 14 brain tumor patients at the Montreal Neurological Institute in 2010. All patients signed a specific consent form for the distrbution of their anonymized images online (NEU-09–010). Each patient had a pre-operative and a post-operative T1-weighted MR with gadolinium and multiple B-mode images pre- and post-resection. Corresponding features were manually selected in some image pairs for validation. All images are in MINC format, the file format used at our institute for image processing.

The images were acquired with our prototype neuronavigation system IBIS NeuroNav by two neurosurgeons: Dr Rolando Del Maestro and Dr Kevin Petrecca wth the help and training of PhD student Laurence Mercier. Neurosurgeon Dr Claire Haegelen and neuroradiologist Dr David Araujo helped selecting manual tags for validation. The principal investgator of this project is Dr Louis Collins.

While this page is under construction, the data is available below.

References

If you use images from our database please cite the following paper:

L. Mercier, R.F. Del Maestro, K. Petrecca, D. Araujo, C. Haegelen, D.L. Collins. On-line database of clinical MR and ultrasound images of brain tumors. Med Phys. 2012 Jun;39(6):3253–61. (link in PubMed)

Data

Some of the images provided have already been used for earlier publications. For that reason, the data are divided in 3 groups with their own characteristics and features.

Group 1: Pre- and post-resection ultrasound images

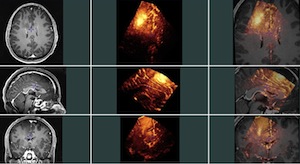
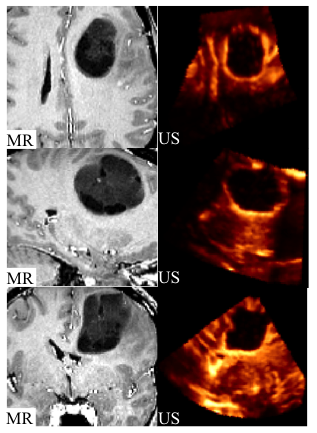
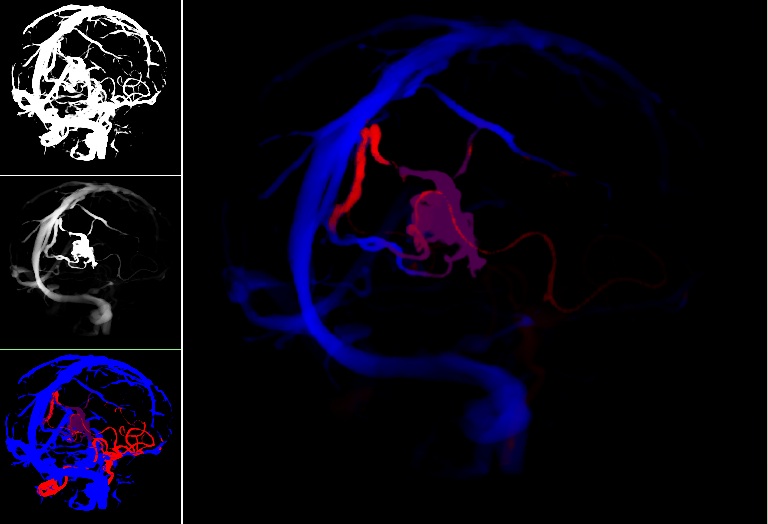
This group contains 2D and 3D ultrasound images before and after tumor resection. For each of the 14 patients, more than one sweep was acquired pre- and post-resection. One of the pre- and one of the post-resection sweeps were chosen to form a pair for which 10 homologous landmarks were chosen by neuroradiologist Dr David Araujo. These landmarks can be used to compute the distance between the 2 images for the validation of registration algorithms.

Download Group1 data (4.6G) Readme file

Group 2: Pre-operative MRI and pre-resection ultrasound images

This group contains 14 pairs of pre-operative MR and pre-resection ultrasound images (2D and 3D). For each MRI-3DUS pair, homologous landmarks were chosen by 2 experts (Dr Louis Collins and Laurence Mercier). The 6 first patients were also tagged by a third expert, neurosurgeon Dr Claire Haegelen. These landmarks can be used to compute the distance between the 2 images for the validation of registration algorithms. In this group, both the MR and ultrasound images were transformed into the MNI Talairach-like brain-based coordinate space (orientation and position only, no scaling), as the manual taggers found it easier to visualize the MRI in that frame of reference.

Download Group2 data (2.1G) Readme file

Group 3: Pre- and post-resection MR images

This section includes MR images taken at two different time points: before and after surgery. The images in this group have not previously been used for a publication and do not therefore have any tags available for registration validation. The MRI are provided in their original scanner frame of reference.

Download Group3 data (565M) Readme file

Group 4: Pre-operative MR and post-resection US images

This group includes pre-operative MR and intra-operative post-resection US images. Data in both MINC and mat (MATLAB) format is provided for all patients. The pre-operative MR data contains the tumour, which is replaced by the resection cavity in the intraoperative US images. Since the tumour in the pre-operative MR does not exist in the post-resection US images, registration of these images is very challenging. Corresponding homologous landmarks are selected in US and MR images for validation of image registration algorithms (15 points in average per patient). Landmarks are selected twice in 6 patients to measure the reproducibility of landmark selection (see the paper below). Please cite the following paper if you use this data:

Rivaz, H., Chen, S, Collins, DL., Automatic Deformable MR-Ultrasound Registration for Image-Guided Neurosurgery, IEEE Trans. Medical Imaging, 2015, 34(2): 366–380 (link in PubMed)

Download Group4 data (591M) Readme file

General instructions: Once you have saved the data on your computer here’s what you need to do do detar and unzip it in Linux: gunzip group?.tar.gz tar -xvvf group?.tar Then please have a look at the accompanying readme files for more information.

A few tips:

  • Files with the extension .mnc are the image files and those with the extension .tag are text files containing the manually selected homologous landmarks.
  • The easiest way to visualize one or two MINC images is to use register. To view a pair of images along with their tags use the following command:
register image1.mnc image2.mnc landmarks.tag
  • Files with the extension .xfm are text files containing transformations. To apply a transformation on a .mnc file, use the tool mincresample. To apply a transformation on a .tag file, use the tool transform_tags
  • To extract the parameters (translations, rotations, etc) from a linear transformation stored in a .xfm file, use: xfm2param.
  • To reconstruct a sweep of 2D images into a 3D volume use volregrid. For example, the command that was used to reconstruct the 3D ultrasounds in this study is the following:
volregrid `volextents -step 0.3 *.mnc -regrid_floor 0.0001 -linear -regrid_radius 0.3 0.3 0.3 -xdircos 1 0 0 -ydircos 0 1 0 -zdircos 0 0 1 *.mnc 3dus.mnc
  • volextents is not part of the standard MINC distribution, but you can download it here.
  • For each 3D ultrasound provided on this web site, the corresponding 2D slices are also available, which means that you can reconstruct your own 3D ultrasound with, for example, a different resolution.

Medial Temporal Lobe (MTL) Segmentation

Our group has developed multiple accurate segmentation methods during years. Our nonlinear patch-based method with error correction is one of the most accurate methods of segmentation of medial temporal lobe structures. Our method reaches 0.901 of Dice similarity with manual tracing for hippocampus which is one of the highest values reported in the literature. Medial temporal lobe atrophy and especially hippocampal atrophy has been one of the most investigated AD biomarkers.

  1. Zandifar, A., Fonov, V. , Coupé, P., Pruessner, J. C.,  & Collins, D. L. (2014). A unified assessment of fully automated hippocampus segmentation methods. Alzheimer’s & Dementia: The Journal of the Alzheimer’s Association10(4), P86.
  2. Zandifar, A., Fonov, V. , Coupé, P., Pruessner, J. C.,  & Collins, D. L. (2015). A quantitative comparison between two manual hippocampal segmentation protocolsAlzheimer’s & Dementia: The Journal of the Alzheimer’s Association, 11(7), P67-P68.

Spinal Surgery

Each year more than 20,000 Canadians are treated surgically for lower back pain. Image guided surgical (IGS) techniques can reduce the number of complications that can arise in classical surgical techniques that can be as high as 20–30%. Intraoperative imaging can further reduce risks by improving accuracy and precision in the placement of pedicular screws used for lumbar fixation. This project will investigate the use of intra-operative ultrasound as an inexpensive alternative to intraoperative CT or MRI. We will develop techniques to precisely identify the boney surface of the vertebrae in both CT and ultrasound and use this information to improve patient-image registration required for image guided spine surgery. This in turn will improve the accuracy in guidance and precision of screw placement and result in better care for the patient.

We have tested the hypothesis that intra-operative ultrasound is viable, precise and clinically relevant to improved precision and will reduce operating time in image guided surgery of the spine. Our specific aims were:

  • To develop an automated model-based method to segment vertebrae of the human spine from 3D computed tomography data and ultrasound data.
  • To develop an automated slice-to-volume registration method using intraoperative 2D ultrasound (US) to align a patient’s vertebra to pre-operative CT images to improve the accuracy of image guided surgery and to reduce the time required for registration.
  • To validate and characterized the accuracy of the registration and segmentation methods in vitro using human plastic spine models, swine models and human cadaver specimens.
  • To evaluate the precision and speed of the ultrasound-based registration method in vivo with patients in the context of lumbo-sacral pedicle screw implantation with respect to landmark-based registration in a commercial navigation system.

Increasing the accuracy of the patient-image registration enabled the surgeon to improve pedicular screw positioning and thus decrease risks for the spinal cord, nerve roots or blood vessels. Improved precision can also increase instrumentation strength, thus preventing loosening of the misplaced hardware. When used with an anterior approach, the IGS system can be used to facilitate removal of disks or tumors, or positioning of artificial disks. By decreasing the time required for the registration procedure, overall operating time will be reduced, implying shorter muscle retraction times with the potential of reduced post-operative pain and reduced risk of infection for the patient. For the clinical team, shorter operating times will reduce fatigue, and may enable completion of more complex procedures with greater assurance. This work was supported by a CIHR operating grant (PI: Collins, co-PIs: Goulet).

References

[1] Fonov VS, Le Troter A, Taso M, De Leener B, Lévêque G, Benhamou M, Sdika M, Benali H, Pradat PF, Collins DL, Callot V, Cohen-Adad J. Framework for integrated MRI average of the spinal cord white and gray matter: The MNI-Poly-AMU template. Neuroimage. 2014 Sep 7;102P2:817–827

[2] G Forestier, F Lalys, DL Collins, J. Meixensberger, S Wassef, T Neumuth, B Goulet, L Riffaud, P Jannin. Multi-site study of surgical practice in neurosurgery based on Surgical Process Models, Journal of Biomedical Informatics, 46(5), October 2013, Pages 822–829

[3] Yan CX, Goulet B, Chen SJ, Tampieri D, Collins DL. Validation of automated ultrasound-CT registration of vertebrae. Int J Comput Assist Radiol Surg. 2012 Jul;7(4):601–10

[4] Yan, C. X., Goulet, B., Tampieri, D., & Collins, D. L. (2012). Ultrasound-CT registration of vertebrae without reconstruction. International journal of computer assisted radiology and surgery, 7(6), 901–909.

[5] C.X.B. Yan, B. Goulet, J. Pelletier, S.J.S. Chen, D. Tampieri and D.L. Collins, “Towards Accurate, Robust and Practical Ultrasound-CT Registration of Vertebrae for Image-Guided Spine Surgery,” International Journal of Computer Assisted Radiology and Surgery, 2011 Jul;6(4):523–37.

Schizophrenia

The NIST Lab has collaborated with the Utrecht group headed by Dr. H. Hulshoff Pol for the past number of years [1, 2, 3]. Her group has used my ANIMAL non-linear registration software with voxel based morphometry (VBM) for morphometric analysis of cerebral MRI of patients with schizophrenia. Recently they have provided evidence which suggests that brain structures reflect overlapping and segregating genetic liabilities for schizophrenia and BD. The overlapping smaller white matter volume and common areas of thinner and/or thicker cortex (thinner right orbitofrontal cortex, thinner right (and left) parahippocampus, and thicker temporoparietal and left superior motor cortices) suggest that both disorders share neurodevelopmental roots. They have also demonstrated excessive thinning of the cortex over time, most pronounced in the temporal and frontal areas, with progression across the span of the illness. This excessive thinning appears related to medication and outcome. Their findings were extended to reveal that cannabis use in patients with schizophrenia resulted in additional thinning in the left dorsolateral prefrontal cortex (DLPFC), left anterior cingulate cortex (ACC) and left occipital lobe as compared to those patients with schizophrenia that did not use cannabis after a 5-year follow-up.

In later papers, they have identified focal grey-matter differences in a number of regions when compared to age-matched controls [4]. They have also found focal white matter changes that suggest abnormal inter-hemispheric connectivity of anterior cortical and sub-cortical brain regions, reflecting decreased hemispheric specialisation in schizophrenia [5]. These results have been partially replicated in a twin study [6,7] and a long term follow-up study [8].

References

[1] Hulshoff Pol HE, van Baal GC, Schnack HG, Brans RG, van der Schot AC, Brouwer RM, van Haren NE, Lepage C, Collins DL, Evans AC, Boomsma DI, Nolen W, Kahn RS. Overlapping and segregating structural brain abnormalities in twins with schizophrenia or bipolar disorder. Arch Gen Psychiatry. 2012 Apr;69(4):349–59

[2] van Haren, Neeltje EM, Hugo G. Schnack, Wiepke Cahn, Martijn P. van den Heuvel, Claude Lepage, Louis Collins, Alan C. Evans, Hilleke E. Hulshoff Pol, and René S. Kahn. “Changes in cortical thickness during the course of illness in schizophrenia.” Archives of general psychiatry. 2011; 68(9): 871–880.

[3] M. Rais, N.E.M. van Haren, W Cahn, H.G. Schnack, C. Lepage, D.L. Collins, A. Evans, H. E. Hulshoff Poll and R.S. Kahn, “Cannabis use and progressive cortical thickness loss in areas rich in CB1 receptors during the first five years of schizophrenia,” European Neuropsychopharmacology, 2010 Dec; 20(12): 855–65.

[4] H. E. Hulshoff Pol, H. G. Schnack, R. C. Mandl, N. E. van Haren, H. Koning, D. L. Collins, A. C. Evans, and R. S. Kahn, “Focal gray matter density changes in schizophrenia,” Arch Gen Psychiatry. 2001; 58: 1118–25.

[5] H. E. Hulshoff Pol, H. G. Schnack, R. C. Mandl, W. Cahn, D. L. Collins, A. C. Evans, and R. S. Kahn, “Focal white matter density changes in schizophrenia: reduced inter-hemispheric connectivity,” Neuroimage. 2004; 21: 27–35.

[6] H. Hulshoff Pol, H. G. Schnack, R. C. Mandl, R. G. H. Brans, N. E. van Haren, W. F. C. Baare, C. J. van Oel, D. L. Collins, A. C. Evans, and R. S. Kahn, “Gray and white matter density changes in monozygotic and same-sex dizygotic twins discordant for schizophrenia: a voxel-based morphometry study,” presented at 10th Annual Meeting of the Organization for Human Brain Mapping, Budapest, Hungary, 2004.

[7] H. E. Hulshoff Pol, H. G. Schnack, R. C. Mandl, R. G. Brans, N. E. van Haren, W. F. Baare, C. J. van Oel, D. L. Collins, A. C. Evans, and R. S. Kahn, Gray and white matter density changes in monozygotic and same-sex dizygotic twins discordant for schizophrenia using voxel-based morphometry, Neuroimage. 2006; 31(2): 482–8.

[8] N. E. van Haren, H. E. Hulshoff Pol, H. G. Schnack, W. Cahn, R. C. Mandl, D. L. Collins, A. C. Evans, and R. S. Kahn, “Focal Gray Matter Changes in Schizophrenia across the Course of the Illness: A 5-Year Follow-Up Study,” Neuropsychopharmacology. 2007; 32: 2057–66.

Augmented Reality Vessel Visualization

We explored a number of different volume rendering methods for AR visualization of vessel topology and blood flow.

Publications

  1. M. Kersten-Oertel, S. Drouin, S. J. S. Chen, D. L. Collins. ‘ “Volume Visualization for Neurovascular Augmented Reality Surgery”. Augmented Reality Environments for Medical Imaging and Computer-Assisted Interventions. Lecture Notes in Computer Science Volume 8090, pp 211–220, 2013.
  2. M. Kersten-Oertel, S.J.S Chen, S. Drouin, D. Sinclair, D. L. Collins. “Augmented Reality Visualization for Guidance in Neurovascular Surgery.” Stud Health Technol Inform 173:225–9. Proceedings of Medicine Meets Virtual Reality (MMVR), New Port, CA, Feb 9–11, 2012.
  3. S. Drouin, M. Kersten-Oertel, S. J. S. Chen, D. L. Collins. “A Realistic Test and Development Environmentfor Mixed Reality in Neurosurgery”. Augmented Environments for Computer Assisted Interventions’ (Proceedings of MICCAI AE-CAI Workshop 2011) Lecture Notes in Computer Science, Volume 7264:13–23, 2012.

Visualizing Blood Flow

Cerebral arteriovenous malformations (AVMs) are a type of vascular anomaly consisting of large intertwined vascular growth (the nidus) that are prone to serious hemorrhaging and can result in patient death if left untreated. Intervention through surgical clipping of feeding and draining vessels to the nidus is a common treatment. However, identification of which vessels to clip is challenging even to experienced surgeons aided by conventional image guidance systems. In this work, we describe our methods for processing static preoperative angiographic images in order to effectively visualize the feeding and draining vessels of an AVM nidus. Maps from level-set front propagation processing of the vessel images are used to label the vessels by colour. Furthermore, images are decluttered using the topological distances between vessels. In order to aid the surgeon in the vessel clipping decision-making process during surgery, the results are displayed to the surgeon using augmented virtuality.

Decluttering and visualizing blood flow

Publications

  1. S. J. S. Chen, M. Kersten-Oertel, S. Drouin, and D. L. Collins. “Visualizing the path of blood flow for image guided surgery of cerebral arteriovenous malformations”. SPIE Medical Imaging, San Diego, CA, Feb 4–9, 2012.
  2. M. Kersten-Oertel, S. J. S. Chen, D. L. Collins. “Enhancing depth perception of volume-rendered angiography data”.VIS 2011 Poster Session, Providence, RI, Oct. 23–38, 2011.
YouTube-logo-full_color