Ultrasound-guided spinal navigation

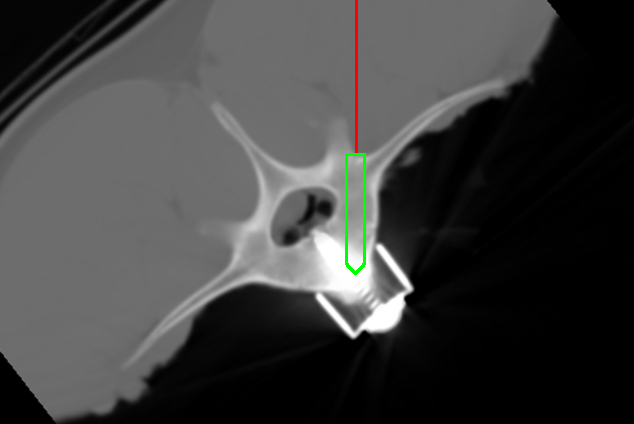
Spinal fusion surgery is a common procedure to treat spinal instability when medication and physical therapy fail. During the last two decades, the number of annual spinal fusion procedures has known a significant increase, with over 413,000 interventions reported in the United States. The surgery consists in rigidly fusing multiple vertebrae using rods and bone grafts to help stabilize the spinal column. The rods are fixed to each vertebra using screws implanted within the vertebral pedicles. In open surgery, the posterior part of the vertebra is exposed and the surgeon uses image-guided surgery (IGS) to align the screw trajectory through unexposed anatomy. The current IGS procedure is based on intra-operative 2D fluoroscopy or 3D computed tomography (CT) imaging, which increases operating time, interrupts the surgical workflow and exposes the patient and the operating room personnel to harmful radiations. In this research, we investigate a radiation-free alternative using intra-operative ultrasound (iUS) imaging for spinal navigation. The objectives are:
  • to address the problem of patient-to-preoperative image alignment during spine surgery;
  • to build an open-source software that provides basic functionality features for pedicle screw navigation;
  • to evaluate the solution in a clinical environment.
Publications:

Multi-contrast PD126 and CTRL17 templates

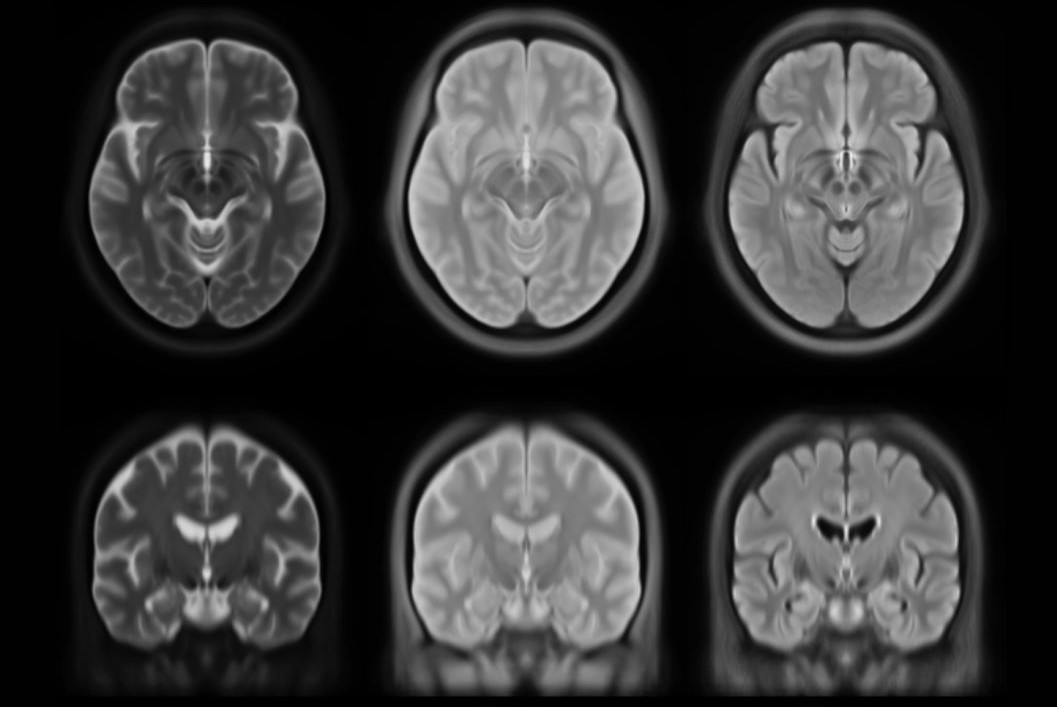
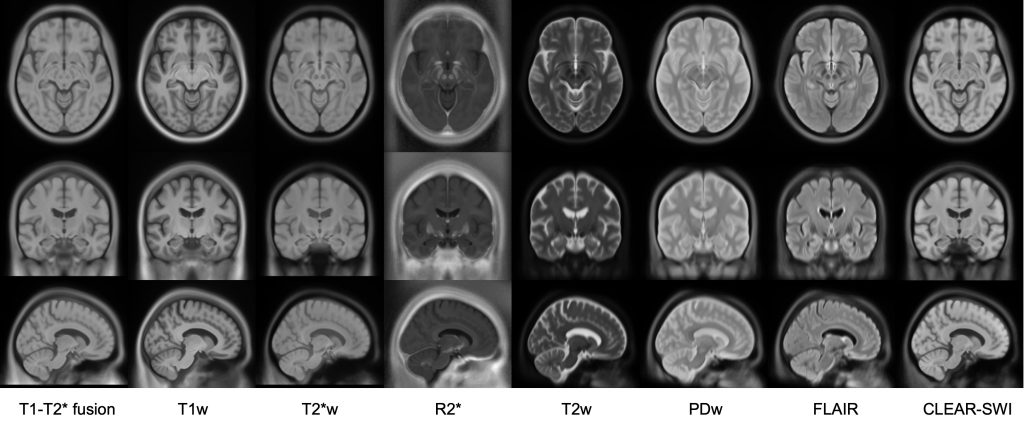
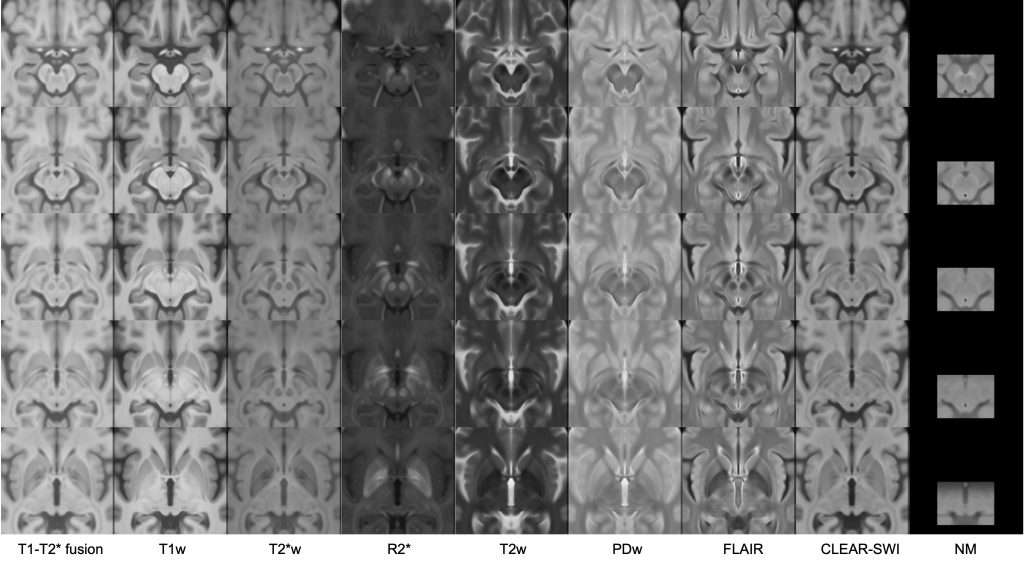
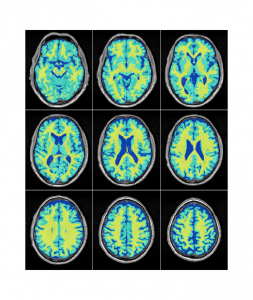
Extending the work from the PD25 template (Xiao et al. 2015, 2017), new population-based multi-contrast templates for 126 Parkinson’s patients and 17 controls are presented here. Nine 3T MRI image contrasts are included: T1w (MPRAGE), T2w, T1-T2 fusion, R2*, T2w, PDw, fluid-attenuated inversion recovery (FLAIR), neuromelanin-sensitive imaging, and improved susceptibility-weighted imaging (CLEAR-SWI; following methods from Eckstein et al. 2021).

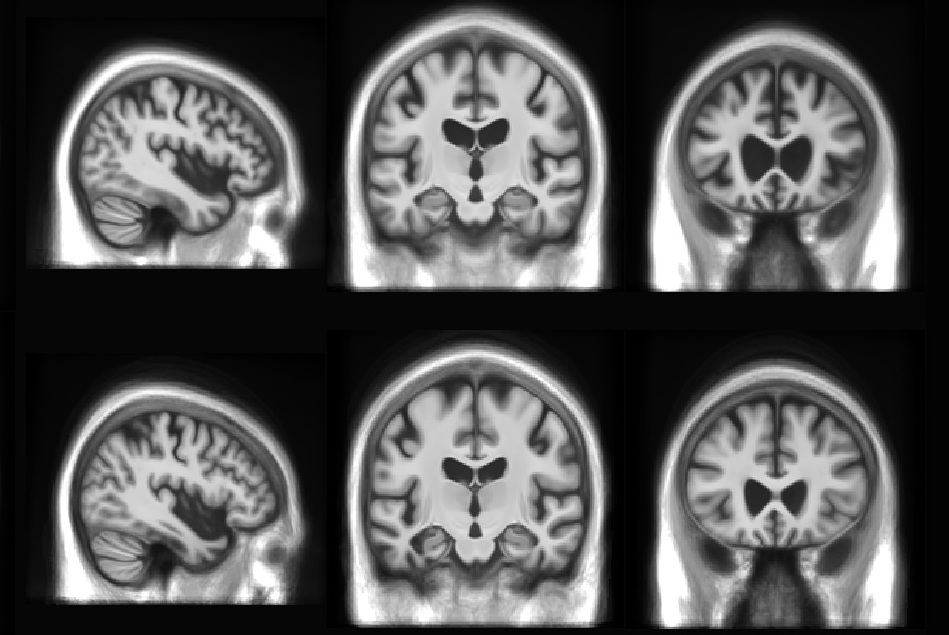
Methods from Xiao et al. 2015 were used to create a T1–T2* fusion MRI volume for each subject that visualizes both cortical and subcortical structures to drive groupwise registration to create the population-based multi-contrast unbiased templates PD126 (shown in figures above) and CTRL17. The finished template is in the same space as the MNI PD25 template, which is the ICBM152 space.

FYI: The subjects used to create these templates were processed differently than the subjects used in the PD25 template. Specifically, the subject data was registered in stx space using an in-house PPMI model (Marek et al. 2011), instead of the ICBM152 model (although both are in ICBM152 stx space). This difference and the different sample of PD patients and controls, changes the scale and shape of the PD126/CTRL17 template by a small amount in comparison to the PD25 template, and hence the PD25 atlas labels do not align exactly on the PD126/CTRL17 templates.

The neuromelanin-sensitive imaging contrast is available in 1×1×1 mm and 0.3×0.3×0.3 mm resolutions, and were created using data from 85 PD patients and 13 controls with neuromelanin data. All other templates are available in three different resolutions: 1×1×1 mm, 0.5×0.5×0.5 mm, and 0.3×0.3×0.3 mm using the full 126 PD patients (44 female; ages=40-87), and 17 healthy controls (13 female; ages=39-84).

The template files that are available include:

PD126
  • MPRAGE T1: PD126-T1MPRAGE-template-{0.3mm,0.5mm,1mm}
  • T2*w: PD126-T2star-template-{0.3mm,0.5mm,1mm}
  • T1-T2* fusion: PD126-fusion-template-{0.3mm,0.5mm,1mm}
  • R2*: PD126-R2star- template-{0.3mm,0.5mm,1mm}
  • T2w: PD126-T2w- template-{0.3mm,0.5mm,1mm}
  • PDw: PD126-PDw- template-{0.3mm,0.5mm,1mm}
  • FLAIR: PD126-FLAIR- template-{0.3mm,0.5mm,1mm}
  • CLEAR-SWI: PD126-CLEARSWI-template -{0.3mm,0.5mm,1mm}
  • NM: PD126-nm- template-{0.3mm,1mm}
CTRL17
  • MPRAGE T1: CTRL17-T1MPRAGE-template-{0.3mm,0.5mm,1mm}
  • T2*w: CTRL17-T2star-template-{0.3mm,0.5mm,1mm}
  • T1-T2* fusion: CTRL17-fusion-template-{0.3mm,0.5mm,1mm}
  • R2*: CTRL17-R2star- template-{0.3mm,0.5mm,1mm}
  • T2w: CTRL17-T2w- template-{0.3mm,0.5mm,1mm}
  • PDw: CTRL17-PDw- template-{0.3mm,0.5mm,1mm}
  • FLAIR: CTRL17-FLAIR- template-{0.3mm,0.5mm,1mm}
  • CLEAR-SWI: CTRL17-CLEARSWI- template-{0.3mm,0.5mm,1mm}
  • NM: CTRL17-nm- template -{0.3mm,1mm}
Publications
Please cite the following article(s) for methods and use of the templates:
  1. V. Madge, V. S. Fonov, Y. Xiao, L. Zou, C. Jackson, R. B. Postuma, A. Dagher, E. A. Fon, D. L. Collins. “A dataset of multi-contrast unbiased average MRI templates of a Parkinson’s disease population,” Data in Brief, vol. 48, pp. 1-9, 2023.

Copyright
Copyright (C) 2022 Victoria Madge, McConnell Brain Imaging Centre, NIST-Lab, Montreal Neurological Institute, McGill University.

License
PD126/CTRL17 templates are distributed under CC BY-NC-SA 4.0 License,

Download
The templates are available to download in MINC2 and NIFTI format here.

Animal Atlases

There are various animal atlases that are available from the BIC in the MINC format. On the following pages you’ll find an overview of the atlas, methods, a link to view them online, and a download of the atlas.

Monkey

MNI Average macaque
MNI Rhesus macaque
MNI Cynomolgus macaque

Sheep

Average ovine template

MNI-FTD Templates

MNI-FTD Templates: Unbiased Average Templates of Frontotemporal Dementia Variants

Standard anatomical templates are widely used in human neuroimaging processing pipelines to facilitate group level analyses and comparisons across different subjects and populations. The MNI-ICBM152 template is the most commonly used standard template, representing an average of 152 healthy young adult brains. However, in patients with neurodegenerative diseases such as frontotemporal dementia (FTD), the high levels of atrophy lead to significant differences between the brain shape of the individuals and the MNI-ICBM152 template. Such differences might inevitably lead to registration errors or subtle biases in downstream analyses and results. Disease-specific templates are therefore desirable to reflect the anatomical characteristics of the populations of interest and to reduce potential registration errors when processing data from such populations.

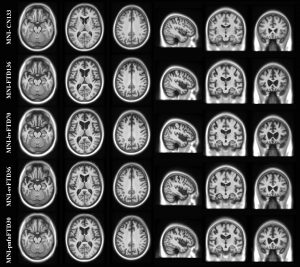
Here, we present MNI-FTD136, MNI-bvFTD70, MNI-svFTD36, and MNI-pnfaFTD30, four unbiased average templates of 136 FTD patients, 70 behavioural variant (bv), 36 semantic variant (sv), and 30 progressive nonfluent aphasia (pnfa) variant FTD patients as well as a corresponding age matched average template of 133 healthy controls (MNI-CN133), along with probabilistic tissue maps for each template. The public availability of these templates will facilitate analyses of FTD cohorts and enable comparisons between different studies in a common standardized space appropriate to FTD populations. All templates are here.

Figure1

Dadar, M., Manera, A. L., Fonov, V. S., Ducharme, S., & Collins, D. L. (2020). MNI-FTD Templates: Unbiased Average Templates of Frontotemporal Dementia Variants. bioRxiv.

CerebrA

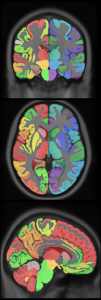
CerebrA atlas

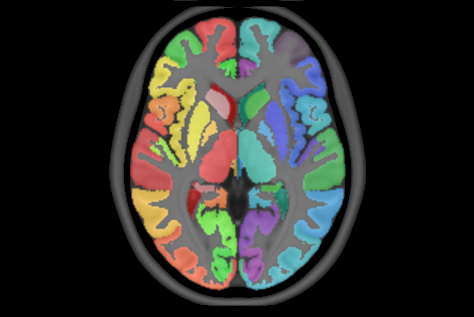
Accurate anatomical atlases are recognized as important tools in brain-imaging research. They are widely used to estimate disease-specific changes and therefore, are of great relevance in extracting regional information on volumetric variations in clinical cohorts in comparison to healthy populations. The use of high spatial resolution magnetic resonance imaging and the improvement in data preprocessing methods have enabled the study of structural volume changes on a wide range of disorders, particularly in neurodegenerative diseases where different brain morphometry analyses are being broadly used in an effort to improve diagnostic biomarkers. In the present dataset, we introduce the Cerebrum Atlas (CerebrA) along with the MNI-ICBM2009c average template. MNI-ICBM2009c is the most recent version of the MNI-ICBM152 brain average, providing a higher level of anatomical details. Cerebra is based on an accurate non-linear registration of cortical and subcortical labelling from Mindboggle 101 to the symmetric MNI-ICBM2009c atlas, followed by manual editing.

MINC2 MINC1 NIFTI

mni_icbm152_nlin_sym_09c_CerebrA

Manera, A. L., Dadar, M., Fonov, V., & Collins, D. L. (2020). CerebrA, registration and manual label correction of Mindboggle-101 atlas for MNI-ICBM152 template. Scientific Data, 7(1), 1-9.


VentRa

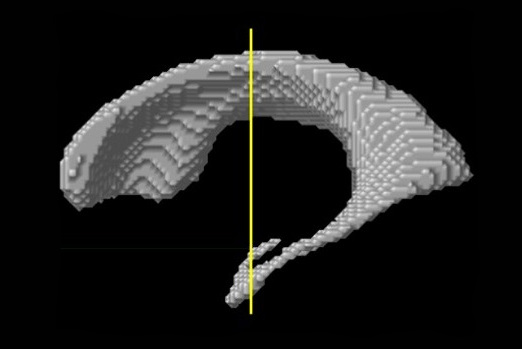
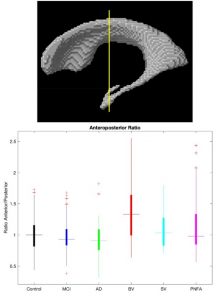
Lateral ventricles are reliable and sensitive indicators of brain atrophy and disease progression in behavioral variant frontotemporal dementia (bvFTD). VentRa takes a comma separated (.csv) file providing the path for the raw T1-weighted images as well as age and sex of the subjects as input, and provides preprocessed images along with ventricle segmentations, QC files for the segmentations, as well as a .csv file including the diagnosis (based on the classifier trained on bvFTD vs the mixed group data) along with all the extracted ventricle features: i.e. total ventricle volume, ventricle volumes in each lobe and hemisphere,anterior-posterior ratio (APR), left-right temporal lobe ratio (LRTR), and left-right frontal ratio (LRFR).

ventra

VentRa Tool

For more details, see:

Ana L. Manera,  Mahsa Dadar, D. Louis Collins, Simon Ducharme, “Ventricle shape features as a reliable differentiator between the behavioral variant frontotemporal dementia and other dementias”, arXiv. https://arxiv.org/abs/2103.03065

DAWM and FWML Seperation

Histopathology and MRI studies differentiate between focal white matter lesions (FWML) and diffuse abnormal white matter (DAWM). These two categories of white matter T2-weighted (T2w) hyperintensities show different degrees of demyelination, axonal loss and immune cell density in pathology, potentially offering distinct correlations with symptoms. We have developed an automated tool to separate FWML and DAWM based on their intensity profile in T2-weighted images.

Lesion Separation Tool Script

Tissue Classification

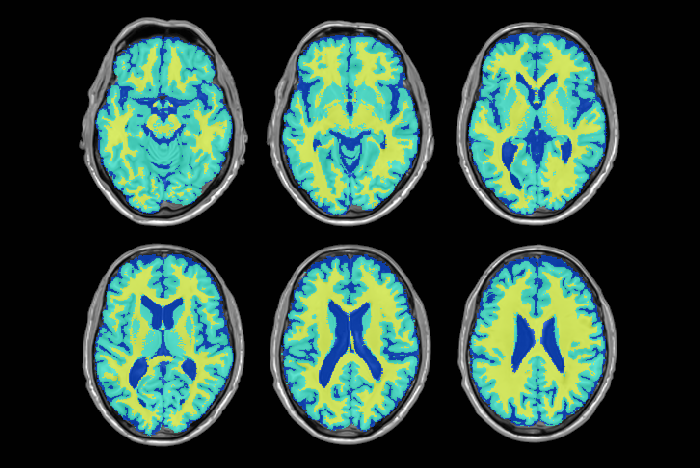
Accurate differentiation of brain tissue types from MR images  is necessary in many neuroscience and clinical applications. Accurate automated tissue segmentation is challenging due to the variability in the tissue intensity profiles caused by differences in scanner models, acquisition protocols, as well as the age of the subjects and presence of pathology. We have developed BISON (Brain tIsue SegmentatiOn pipeliNe), a new pipeline for tissue segmentation using a random forests classifier and a set of intensity and location priors obtained based on T1w images.

BISON Pipelineweb

Execution Example:

python BISON.py -c RF -m Trained_Classifiers/ -o Outputs/ -t Temp_Files/ -e PT -n List.csv -p Trained_Classifiers/ -l 3


Multi-contrast PD25 atlas


images-NIST.003
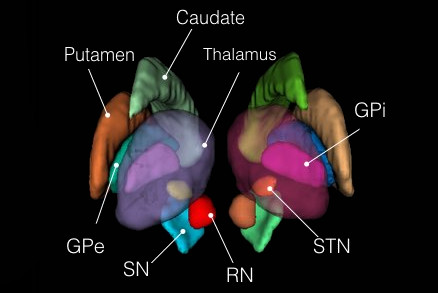
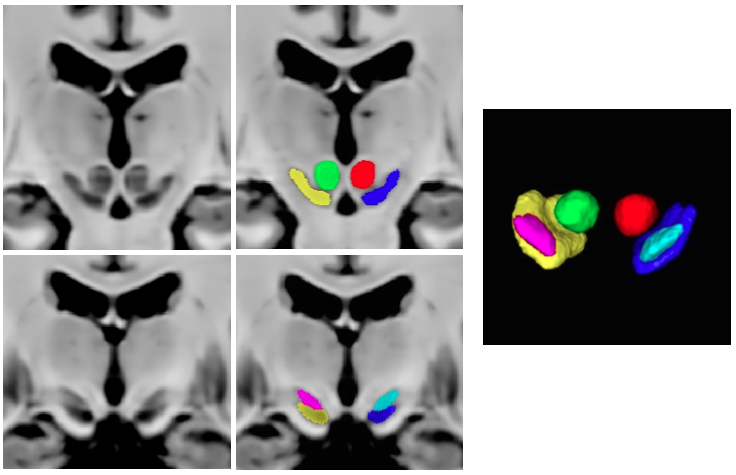
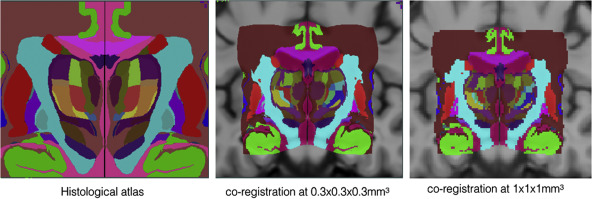
This set of multi-contrast population-averaged PD brain atlas contains 5 different image contrasts:  T1w ( FLASH & MPRAGE), T2*w, T1–T2* fusion, phase, and an R2* map. Probabilistic tissue maps of whiter matter, grey matter, and cerebrospinal fluid are provided for the atlas. We also manually segmented eight subcortical structures: caudate nucleus, putamen, globus pallidus internus and externus (GPi & GPe), thalamus, STN, substantia nigra (SN), and the red nucleus (RN). Lastly, a co-registered histology-derived digitized atlas containing 123 anatomical structures is included.
 
segmentation-demo1-s2.0-S2352340917301452-gr5
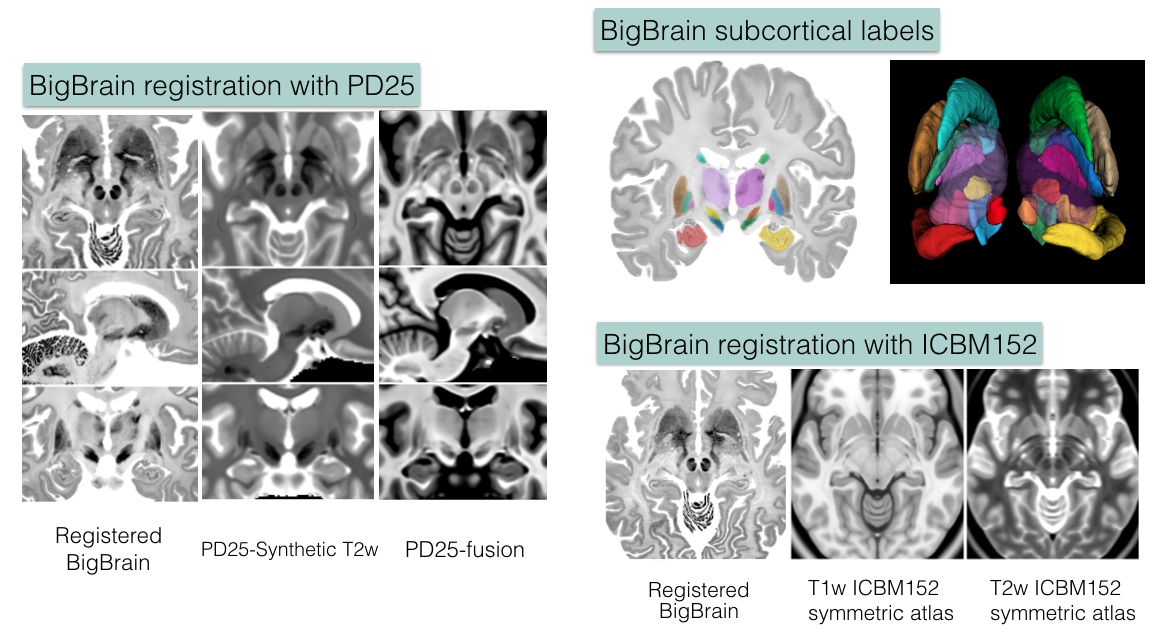
We employed a novel T1–T2* fusion MRI that visualizes both cortical and subcortical structures to drive groupwise registration to create co-registered multi-contrast  unbiased templates from 25 PD patients that later went for the STN deep brain stimulation procedure. The finished atlas is in ICBM152 space. Three different resolutions are provided: 1×1×1 mm, 0.5×0.5×0.5 mm, and sectional 0.3×0.3×0.3 mm.

The included files are as followed:
R2* map: PD25-R2starmap-atlas-{0.3mm, 0.5mm, 1mm}
phase map: PD25-phase-atlas-{0.3mm, 0.5mm, 1mm}
MPRAGE T1: PD25-T1MPRAGE-template-{0.3mm, 0.5mm. 1mm}
FLASH T1: PD25-T1GRE-template-{0.3mm, 0.5mm, 1mm}
T2*w: PD25-T2star-template-{0.3mm, 0.5mm, 1mm}

T1-T2* fusion: PD25-fusion-template-{0.3mm, 0.5mm, 1mm}

Brain masks: PD25-atlas-mask-{0.3mm, 0.5mm, 1mm}
Probabilistic brain tissue maps: PD25-{WM,GM,CSF}-tissuemap
8 subcortical structure segmentation: PD25-subcortical-1mm
High resolution midbrain nuclei manual segmentation: PD25-midbrain-0.3mm

Co-registered histological atlas:  PD25-histo-{0.3mm, 1mm}

midbrain labels: PD25-midbrain-labels.csv
Subcortical labels: PD25-subcortical-labels.csv
Histological labels: PD25-histo-labels.csv


BigBrain co-registration

To help bridge the insights of micro and macro-levels of the brain, the Big Brain atlas was nonlinearly registered to the PD25 and ICBM152 (symmetric and asymmetric) atlases in a multi-contrast registration strategy, and subcortical structures were manually segmented for BigBrain, PD25 , and ICBM152 atlases. To help relate PD25 atlas to clinical T2w MRI, a synthetic T2w PD25 atlas was also created. The registered BigBrain atlases are available at the resolutions of 1×1×1 mm, 0.5×0.5×0.5 mm, and 0.3×0.3×0.3 mm.
Screen Shot 2019-02-23 at 11.06.48 PM
Data related to BigBrain co-registration:

1. Deformed BigBrain atlases:

  • BigBrain in PD25 space: BigBrain-to-PD25-nonlin-{300um, 0.5mm, 1mm}
  • BigBrain in ICBM152 symmetric atlas: BigBrain-to-ICBM2009sym-nonlin-{300um, 0.5mm, 1mm}
  • BigBrain in ICBM152 asymmetric atlas: BigBrain-to-ICBM2009asym-nonlin-{300um, 0.5mm, 1mm}
  • Synthetic T2w PD25 atlas: PD25-SynT2-template-{300um, 0.5mm, 1mm}
  • T1-T2* fusion PD25 atlas: PD25-enhanceFusion-template-{300um, 0.5mm, 1mm}

2. Manual subcortical segmentations:

  • BigBrain coregistered to ICBM in the BigBrain2015 release: BigBrain-segmentation-0.3mm
  • MNI PD25: PD25-segmentation-0.5mm
  • ICBM152 2009b symmetric: ICBM2009b_sym-segmentation-0.5mm
  • ICMB152 2009b asymmetric: ICBM2009b_asym-segmentation-0.5mm

3. Related transformations:

  • BiBrain-to-PD25: BigBrain-to-PD25-nonlin.xfm
  • BigBrain-to-ICBM2009asym: BigBrain-to-ICBM2009asym-nonlin.xfm
  • BigBrain-to-ICBM2009sym: BigBrain-to-ICBM2009sym-nonlin.xfm
  • PD25-to-ICBM2009asym: PD25-to-ICBM2009asym-nonlin.xfm
  • PD25-to-ICBM2009sym: PD25-to-ICBM2009sym-nonlin.xfm

4. List of subcortical labels: subcortical-labels.csv


Publications

For the methods used, and to use the atlas for research purposes, please cite the following articles:
  1. Y. Xiao, V. Fonov, S. Beriault, F.A. Subaie, M.M. Chakravarty, A.F. Sadikot, G. Bruce Pike, and D. Louis Collins, “A dataset of multi-contrast population-averaged brain MRI atlases of a Parkinson’s disease cohort,” accepted in Data in Brief, 2017.
  2. Y. Xiao, V. Fonov, S. Beriault, F.A. Subaie, M.M. Chakravarty, A.F. Sadikot, G. Bruce Pike, and D. Louis Collins, “Multi-contrast unbiased MRI atlas of a Parkinson’s disease population,” International Journal of Computer-Assisted Radiology and Surgery, vol. 10(3), pp. 329-341, 2015.
  3. Y. Xiao, S. Beriault, G. Bruce Pike, and D. Louis Collins, “Multicontrast multiecho FLASH MRI for targeting the subthalamic nucleus,” Magnetic Resonance Imaging, vol. 30, pp. 627-640, 2012.

If you are using the BigBrain atlas co-registration dataset, please refer to the following preprint:

  1. Y. Xiao, J.C. Lau, T. Anderson, J. DeKraker, D. Louis Collins, T. Peters, and A.R. Khan, “Bridging micro and macro: accurate registration of the BigBrain dataset with the MNI PD25 and ICBM152 atlases,” 

If you are using the Big Brain data, please cite the following publication:

  1. Amunts, K. et al.: “BigBrain: An Ultrahigh-Resolution 3D Human Brain Model”, Science (2013) 340 no. 6139 1472-1475, June 2013

Copyright

Copyright (C) 2016,2017,2018 Yiming Xiao, McConnell Brain Imaging Centre,
Montreal Neurological Institute, McGill University.

License

PD25 atlases are distributed under CC BY-NC-SA 3.0 Licence

Dataset for BigBrain co-registration with PD25 and ICBM152 is under CC BY 4.0 Licence. Note that this exception to the existing BigBrain dataset does not alter the general term of the license for the use of BigBrain itself, which is still under CC BY-NC-SA 4.0 License.

Download

Version 20170213: Download archives containing brain atlases, brain masks, midbrain and subcortical segmentation and histological labels: MINC1, MINC2, NIFTI

Version 20160706: Download archives containing brain atlases, brain masks and midbrain segmentation: MINC1, MINC2, NIFTI

Co-registration of BigBrain with PD25 and ICBM152 atlases: Download archives containing registered Big Brain atlas, manual segmentations, and registration transformation (only available in MINC2 package): MINC2, NIFTI

Ultrasound and Augmented Reality

For intraoperative use, neuronavigation systems must relate the physical location of a patient with the preoperative models by means of a transformation that relates the two through a patient-to-image mapping. By tracking the patient and a set of specialized surgical tools, this mapping allows a surgeon to point to a specific location on the patient and see the corresponding anatomy on the patient specific models. However, throughout the intervention, hardware movement, an imperfect patient-image mapping, and movement of brain tissue during surgery invalidates the patient-to-image mapping. These sources of inaccuracy, collectivey described as ‘brain shift’, reduce the effectiveness of using preoperative patient specific models intraoperatively. Additionally, the surgeon is left with the cognitive burden of merging the virtual models of the patient with the visible and invisible physical anatomy.

An underlying advantage of IBIS (IBIS Neuronav) is that it allows for both individual streams of research as well as the combination of different streams to overcome major or minor pitfalls within them. This is demonstrated through our combination of iUS and AR for improving the accuracy of AR visualizations during tumour neurosurgeries. With this combination of technologies, the interpretation difficulties associated with US images are mediated with detailed AR visualizations and the accuracy issues associated with AR are corrected through registration of the US images. This allows for improved patient-specific planning intra-operatively by both prolonging the reliable use of neuronavigation and the understanding of complex three dimensional medical imaging data so that different surgical strategies can be adapted when necessary.

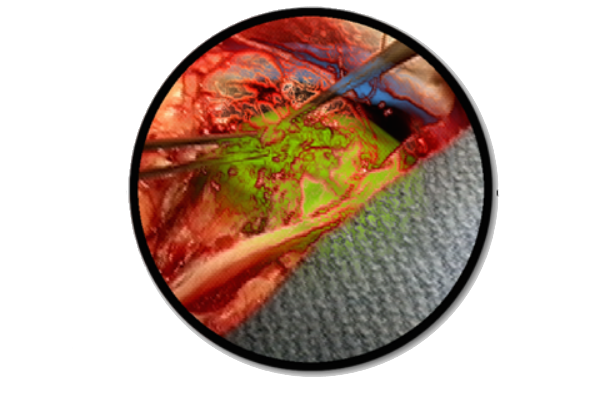
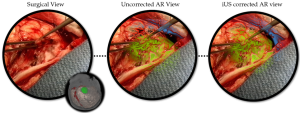
The avatar represents the orientation of the patient’s head. The surgical field of view (left), the AR view before US correction where the tumour seems to conform unnaturally to the surrounding tissue (middle), and the brain shift corrected AR view where the tumour visualization now lines up naturally with surrounding tissue and can be used for accurate intra-operative planning.

Publications

[1] Gerard, Ian J., Marta Kersten-Oertel, Simon Drouin, Jeffery A. Hall, Kevin Petrecca, Dante De Nigris, Tal Arbel, and D. Louis Collins. “Improving Patient Specific Neurosurgical Models with Intraoperative Ultrasound and Augmented Reality Visualizations in a Neuronavigation Environment.” InClinical Image-Based Procedures. Translational Research in Medical Imaging, pp. 28-35. Springer International Publishing, 2015.

[2] Gerard, Ian J., Marta Kersten-Oertel, Simon Drouin, Jeffery A. Hall, Kevin Petrecca, Dante De Nigris, Tal Arbel, and D. Louis Collins. “Improving Augmented Reality Tumour Visualization With Intraoperative Ultrasound In Image Guided Neurosurgery: Case Report.” International Journal of Radiology and Surgery 10(S1):1-312, 2015.


YouTube-logo-full_color