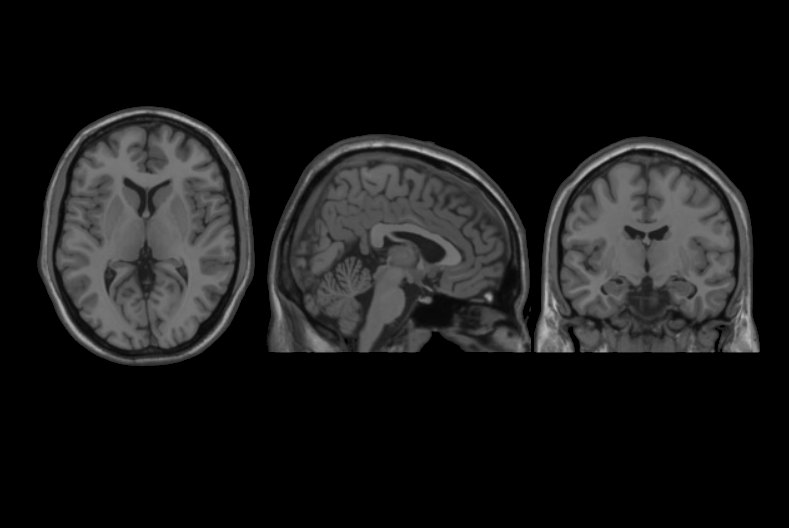
We present an unbiased standard magnetic resonance imaging template brain volume for pediatric data from the 4.5 to 18.5y age range. These volumes were created using data from 324 children enrolled in the NIH-funded MRI study of normal brain development (Almli et al., 2007, Evans and Group 2006). Tools for using these atlases can be found in the Software section.
Viewing
To view the atlases online, click on the appropriate JIV2 link in the Download section below.
Online viewing requires Java browser support. The Java Internet Viewer (JIV2) used here is available for download and personal use under the GNU general public license (GPL).
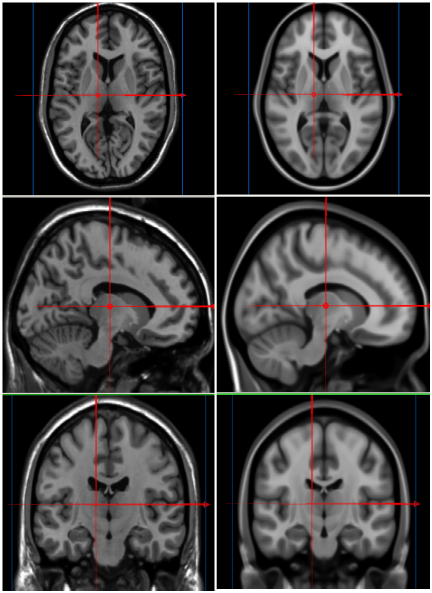
When viewing, the MNI stereotaxic coordinates (X,Y,Z) are displayed in the first row below the volumes. One can use the left most mouse button to click on any image, and the other cross-sectional images will be updated with the appropriate position. You can also hold the middle/rocker mouse button down while moving up or down, to pan through the image plane. Holding ‘Shift’ with the left or middle button will enable dragging and zooming. When looking at the images, remember that left is left and right is right!
Methods
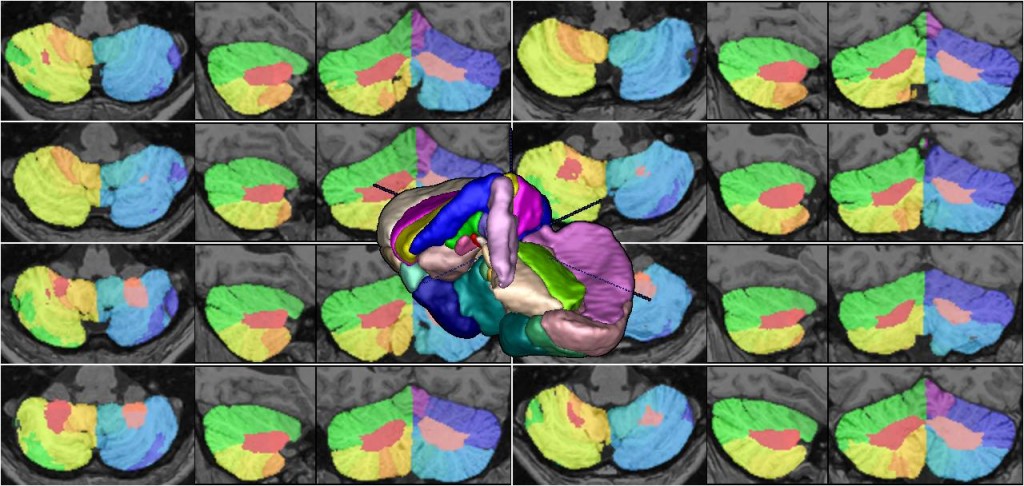
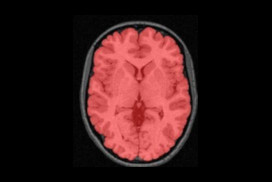
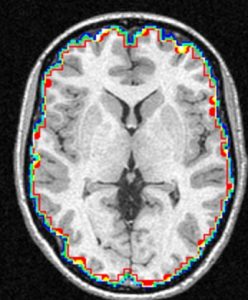
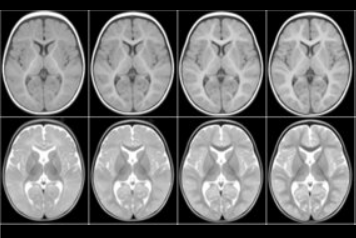
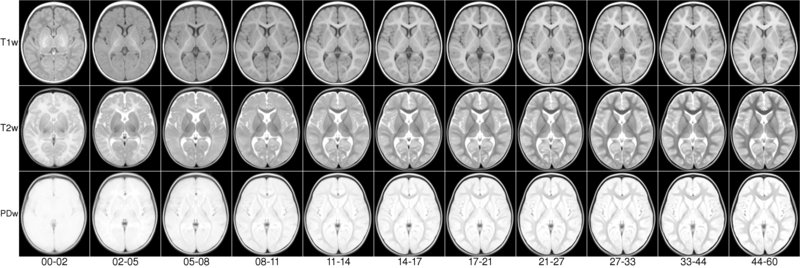
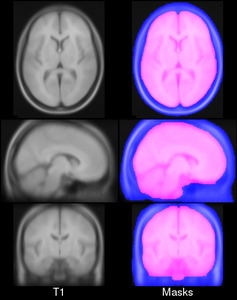
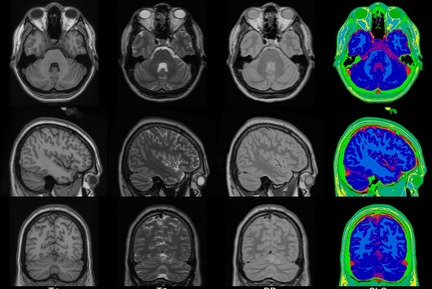
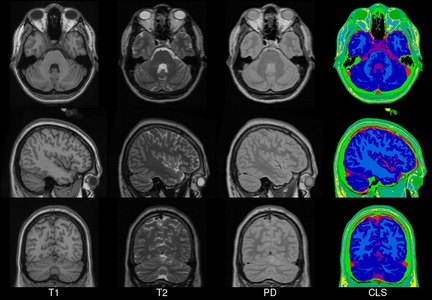
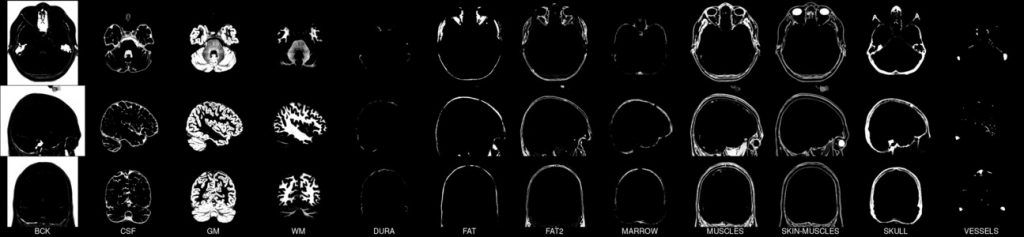
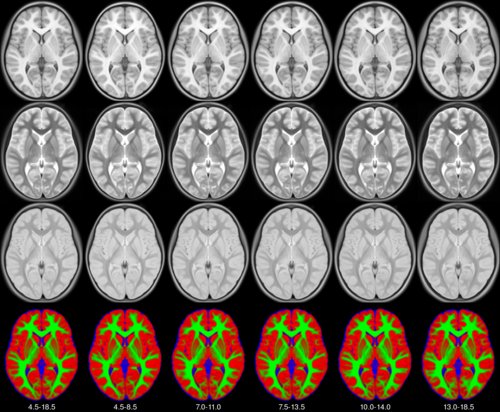
The pediatric average atlases are comprised of:
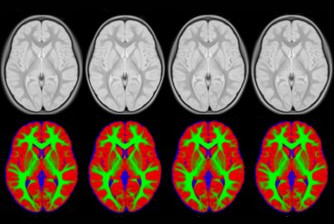
Image pre-processing included non-uniform intensity correction (Sled, 1998) and intensity normalization to a range of 0–100. All T1w MRI data was then transformed into the Talairach-like MNI stereotaxic space using minctracc (Collins, Neelin et al. 1994). Brain masking was performed using BET (Smith, 2002). Age-based subgroups of subjects were created, and all scans within each group were then automatically re-registered to the stereotaxic space using the appropriate template. For each group, an iterative nonlinear co-registration algorithm (Grabner, Janke et al. 2006, Fonov, 2010), was applied to obtain the group averages. The T1-based transformation was then applied to the T2, PD and tissue classified volumes to generate average atlases for these data. Methodological details can be found in (Fonov, 2010).
Publications
The following publications should be referenced when using this atlas:
VS Fonov, AC Evans, K Botteron, CR Almli, RC McKinstry, DL Collins and BDCG, Unbiased average age-appropriate atlases for pediatric studies, NeuroImage, In Press, ISSN 1053–8119, DOI:10.1016/j.neuroimage.2010.07.033
VS Fonov, AC Evans, RC McKinstry, CR Almli and DL Collins Unbiased nonlinear average age-appropriate brain templates from birth to adulthood NeuroImage, Volume 47, Supplement 1, July 2009, Page S102 Organization for Human Brain Mapping 2009 Annual Meeting, DOI: 10.1016/S1053-8119(09)70884-5
License
Copyright (C) 1993–2004 Vladimir S. Fonov, Louis Collins, McConnell Brain Imaging Centre, Montreal Neurological Institute, McGill University. Permission to use, copy, modify, and distribute this software and its documentation for any purpose and without fee is hereby granted, provided that the above copyright notice appear in all copies. The authors and McGill University make no representations about the suitability of this software for any purpose. It is provided “as is” without express or implied warranty. The authors are not responsible for any data loss, equipment damage, property loss, or injury to subjects or patients resulting from the use or misuse of this software package.
Comparing different ages
To compare between different paediatric atlases, click here and choose the desired ages. Note that the adult template is also included for reference (18.5–43 y.o): ICBM 152 Nonlinear atlases version 2009.
Download
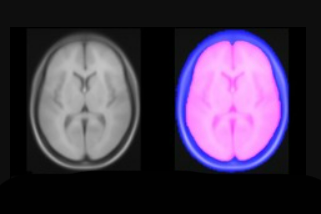
You can download templates constructed for different age ranges. For each age range you will get an average T1w, T2w, PDw maps normalized between 0 and 100 and tissue probability maps, with values between 0 and 1. Also each age range includes a binary brain mask.
Left-Right Symmetric templates
- All Left-Right Symmetric templates for all age ranges in one archive: MINC1 357MB, MINC2 356MB, NIFTI 338MB, or JIV2 (for online viewing)
- 4.5–18.5 y.o (the whole age range): MINC1 61MB, MINC2 61MB, NIFTI 57MB, or JIV2 (for online viewing)
- 4.5–8.5 y.o (prepuberty): MINC1 59MB,MINC2 59MB, NIFTI 56MB, or JIV2 (for online viewing)
- 7–11 y.o (pre- to early puberty): MINC1 59MB, MINC2 59MB, NIFTI 56MB, or JIV2 (for online viewing)
- 7.5–13.5 y.o (pre- to mid puberty): MINC1 60MB, MINC2 60MB, NIFTI 57MB, or JIV2 (for online viewing)
- 10–14 y.o (early to advanced puberty): MINC1 60MB, MINC2 60MB, NIFTI 57MB, or JIV2 (for online viewing)
- 13–18.5 y.o (post puberty): MINC1 60MB, MINC2 60MB, NIFTI 57MB, or JIV2 (for online viewing)
Asymmetric (natural) templates
- All Asymmetric (natural) templates for all age ranges in one archive: MINC1 357MB, MINC2 356MB, NIFTI 338MB, or JIV2 (for online viewing)
- 4.5–18.5 y.o (the whole age range): MINC1 60MB, MINC2 60MB, NIFTI 57MB, or JIV2 (for online viewing)
- 4.5–8.5 y.o (prepuberty): MINC1 59MB, MINC2 59MB, NIFTI 57MB, or JIV2 (for online viewing)
- 7–11 y.o (pre- to early puberty): MINC1 59MB, MINC2 59MB, NIFTI 57MB, or JIV2 (for online viewing)
- 7.5–13.5 y.o (pre- to mid puberty): MINC1 59MB, MINC2 59MB, NIFTI 57MB, or JIV2 (for online viewing)
- 10–14 y.o (early to advanced puberty): MINC1 59MB, MINC2 59MB, NIFTI 57MB, or JIV2 (for online viewing)
- 13–18.5 y.o (post puberty): MINC1 60MB, MINC2 60MB, NIFTI 57MB, or JIV2 (for online viewing)
Contact
For questions related to the MNI NIHPD atlases (rather than the website), contact Vladimir Fonov