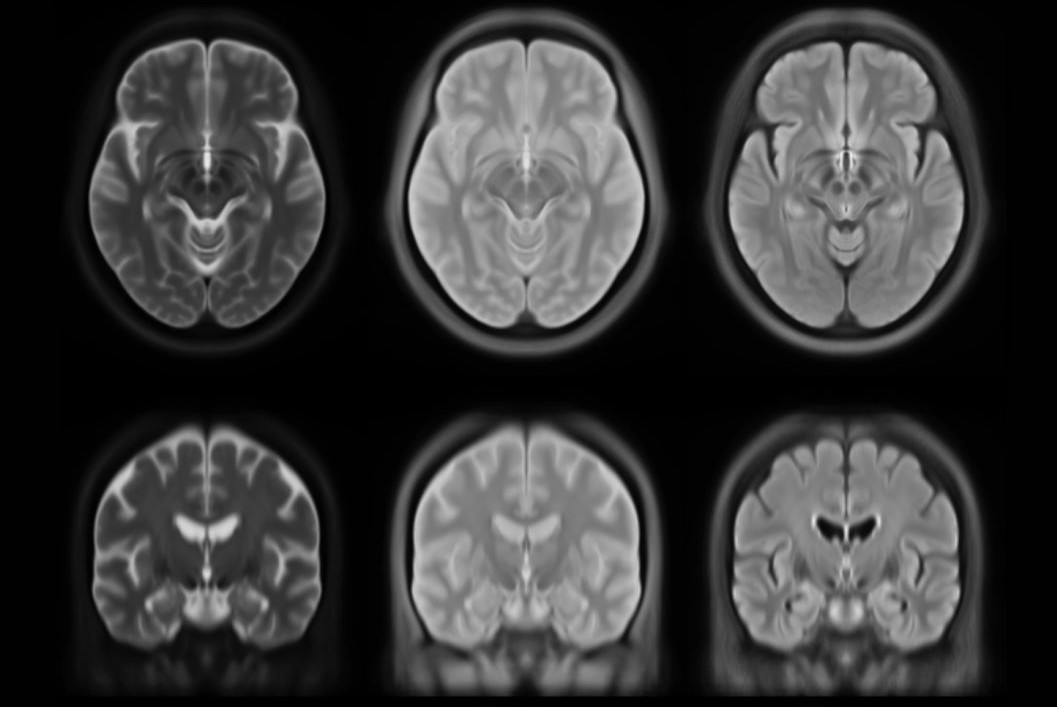
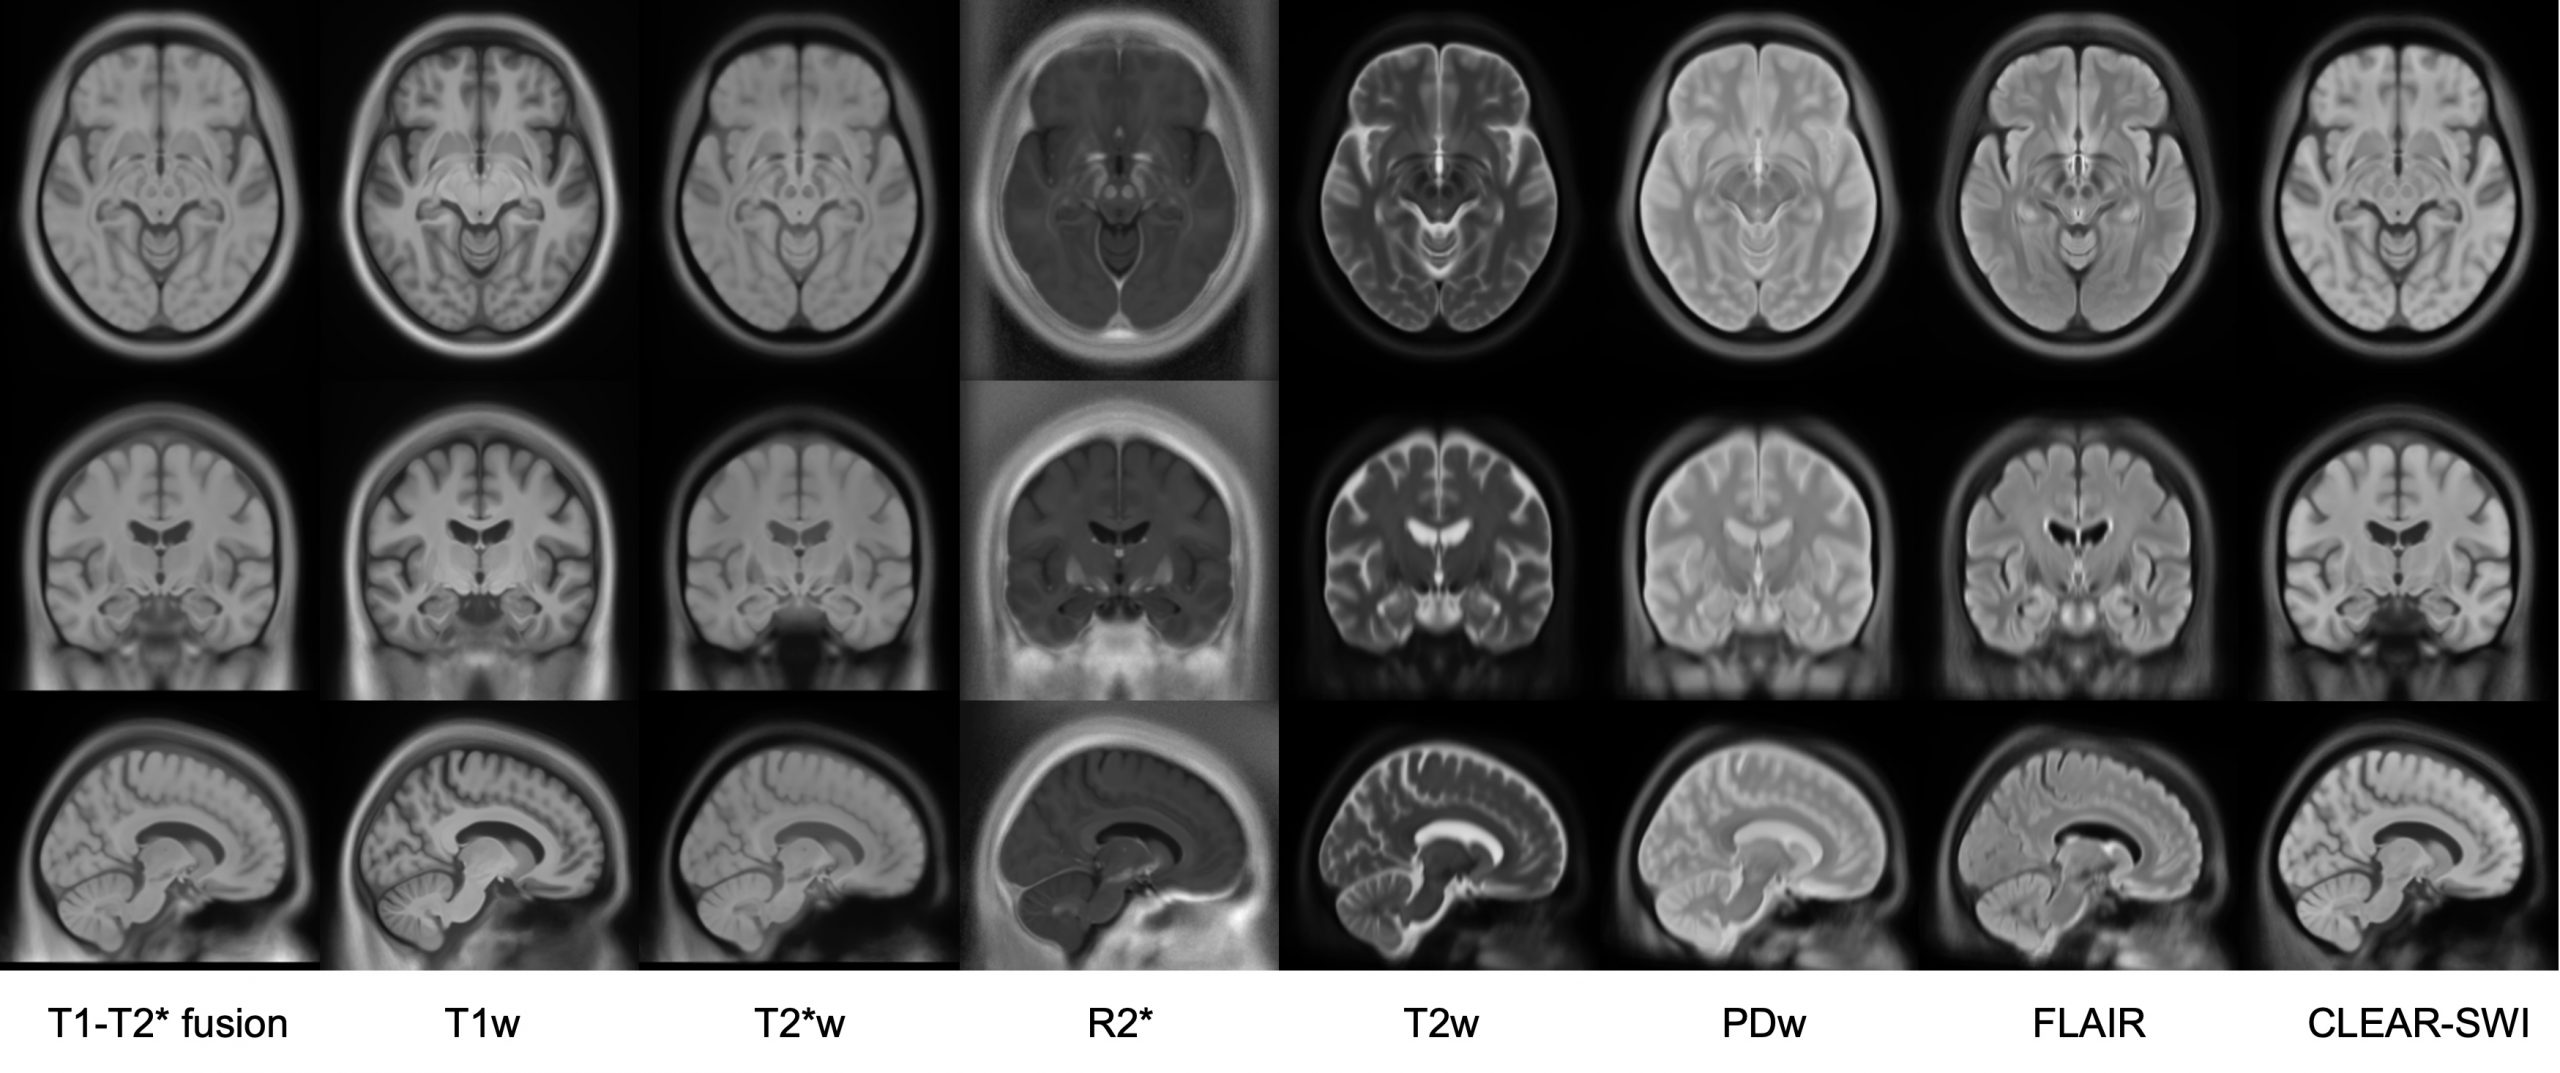
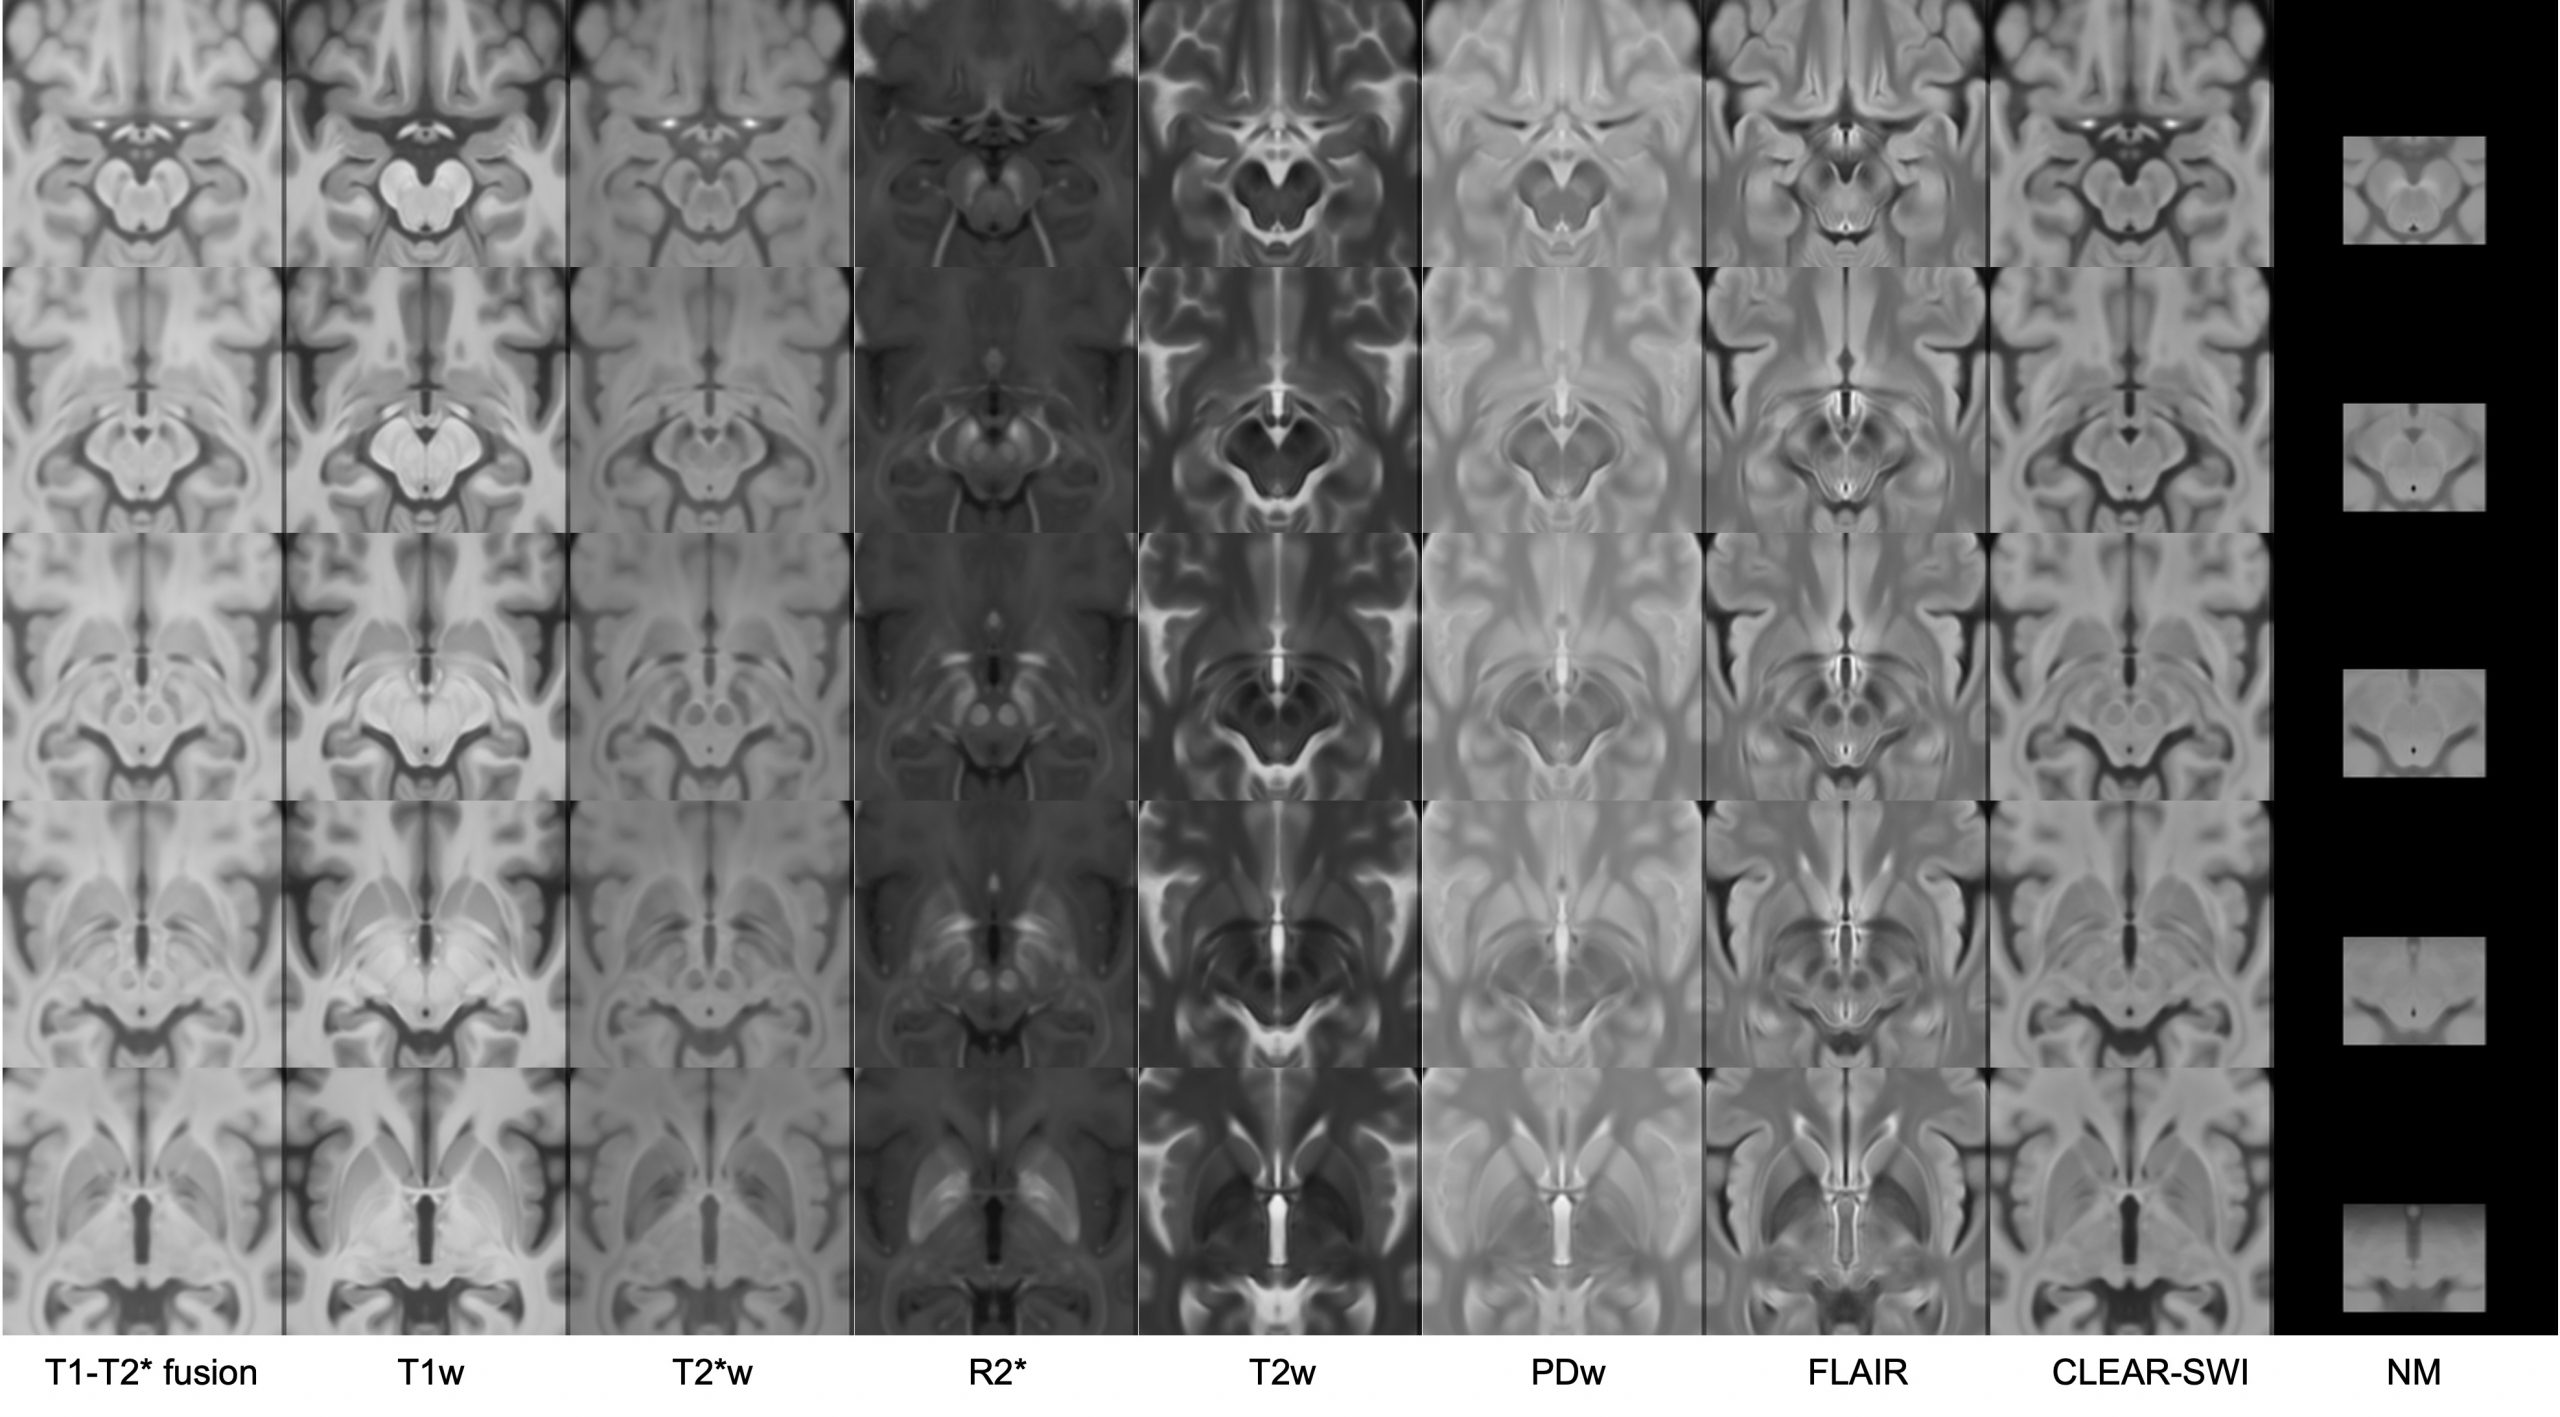
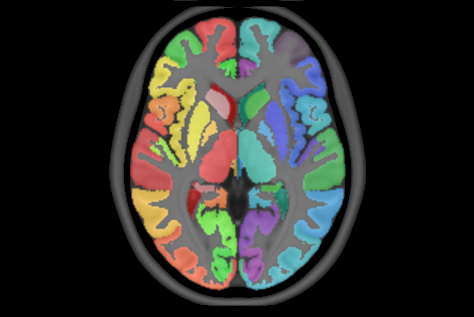
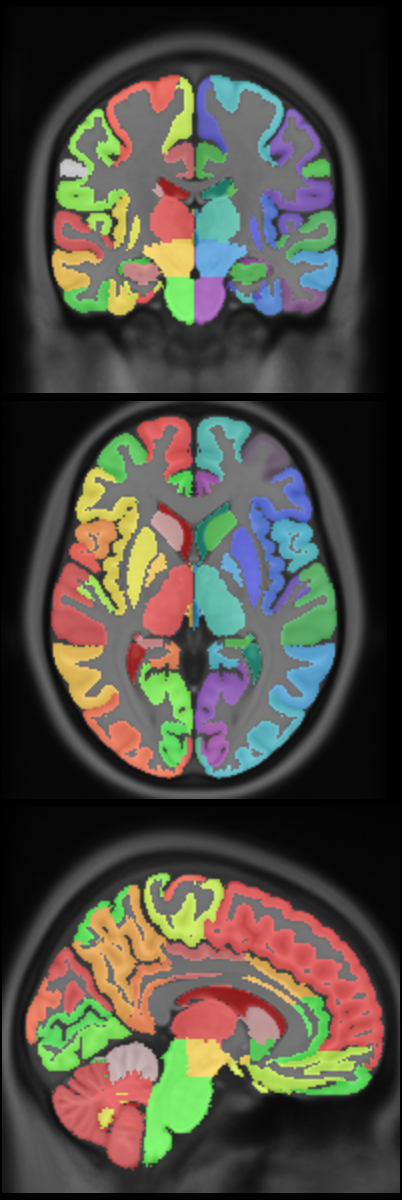
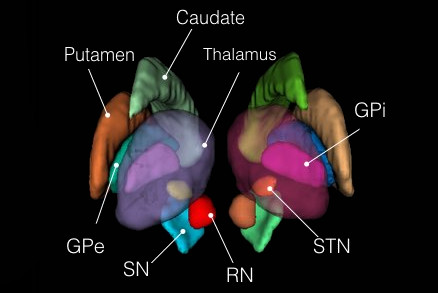
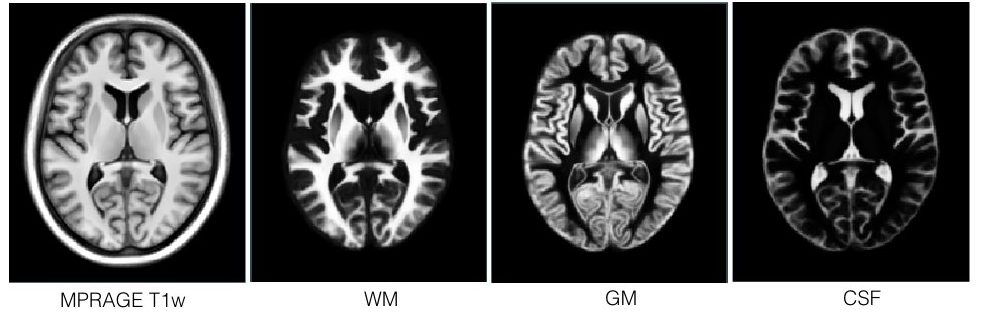
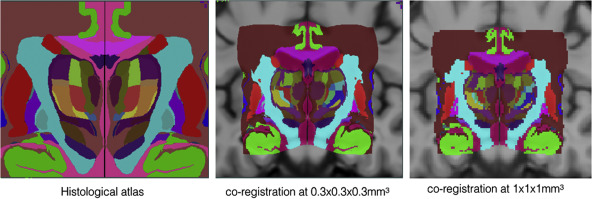
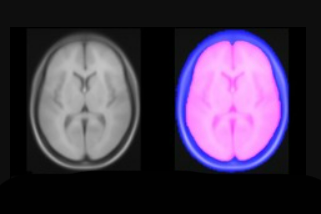
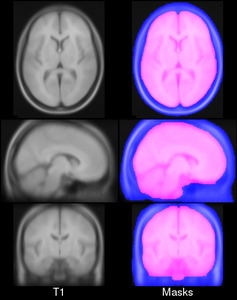
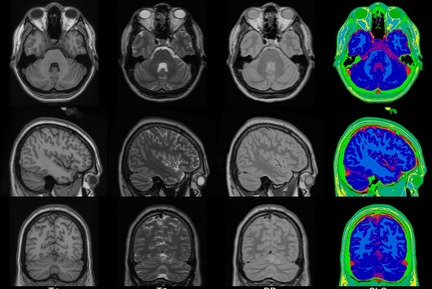
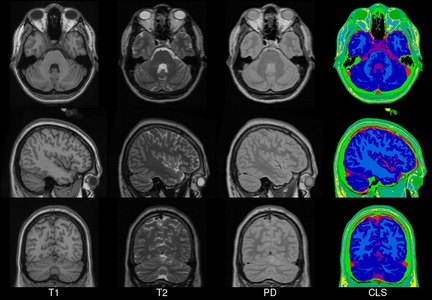
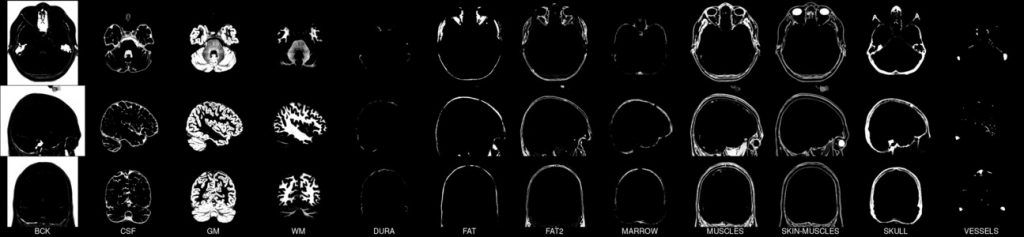
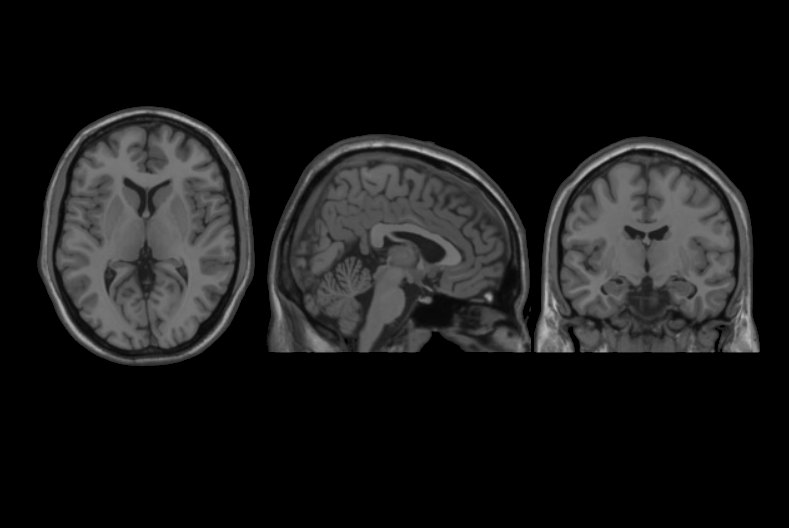
This set of multi-contrast population-averaged PD brain atlas contains 5 different image contrasts: T1w ( FLASH & MPRAGE), T2*w, T1–T2* fusion, phase, and an R2* map. Probabilistic tissue maps of whiter matter, grey matter, and cerebrospinal fluid are provided for the atlas. We also manually segmented eight subcortical structures: caudate nucleus, putamen, globus pallidus internus and externus (GPi & GPe), thalamus, STN, substantia nigra (SN), and the red nucleus (RN). Lastly, a co-registered histology-derived digitized atlas containing 123 anatomical structures is included.
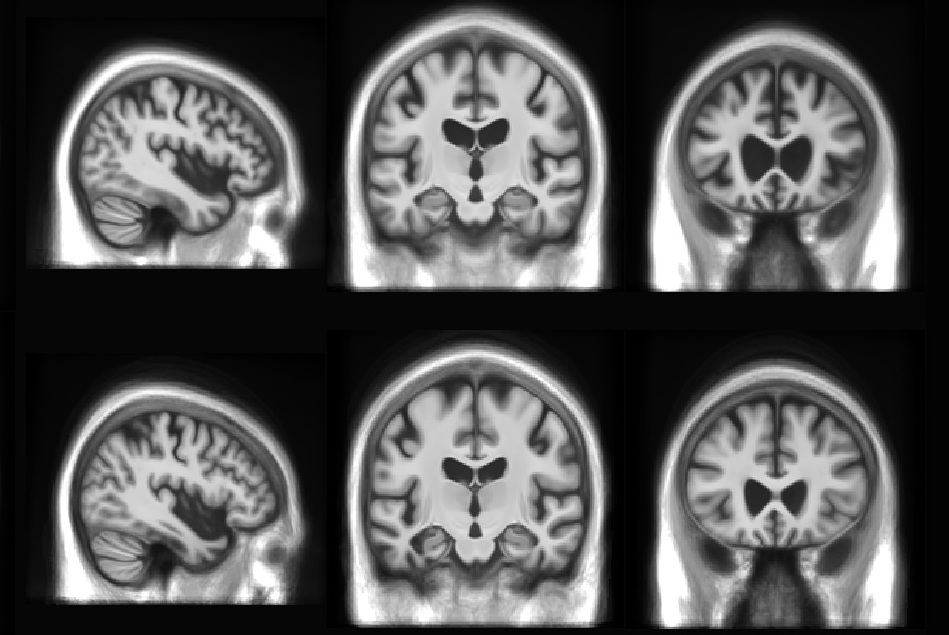
We employed a novel T1–T2* fusion MRI that visualizes both cortical and subcortical structures to drive groupwise registration to create co-registered multi-contrast unbiased templates from 25 PD patients that later went for the STN deep brain stimulation procedure. The finished atlas is in ICBM152 space. Three different resolutions are provided: 1×1×1 mm, 0.5×0.5×0.5 mm, and sectional 0.3×0.3×0.3 mm.
The included files are as followed:
R2* map: PD25-R2starmap-atlas-{0.3mm, 0.5mm, 1mm}
phase map: PD25-phase-atlas-{0.3mm, 0.5mm, 1mm}
MPRAGE T1: PD25-T1MPRAGE-template-{0.3mm, 0.5mm. 1mm}
FLASH T1: PD25-T1GRE-template-{0.3mm, 0.5mm, 1mm}
T2*w: PD25-T2star-template-{0.3mm, 0.5mm, 1mm}
T1-T2* fusion: PD25-fusion-template-{0.3mm, 0.5mm, 1mm}
Brain masks: PD25-atlas-mask-{0.3mm, 0.5mm, 1mm}
Probabilistic brain tissue maps: PD25-{WM,GM,CSF}-tissuemap
8 subcortical structure segmentation: PD25-subcortical-1mm
High resolution midbrain nuclei manual segmentation: PD25-midbrain-0.3mm
Co-registered histological atlas: PD25-histo-{0.3mm, 1mm}
midbrain labels: PD25-midbrain-labels.csv
Subcortical labels: PD25-subcortical-labels.csv
Histological labels: PD25-histo-labels.csv
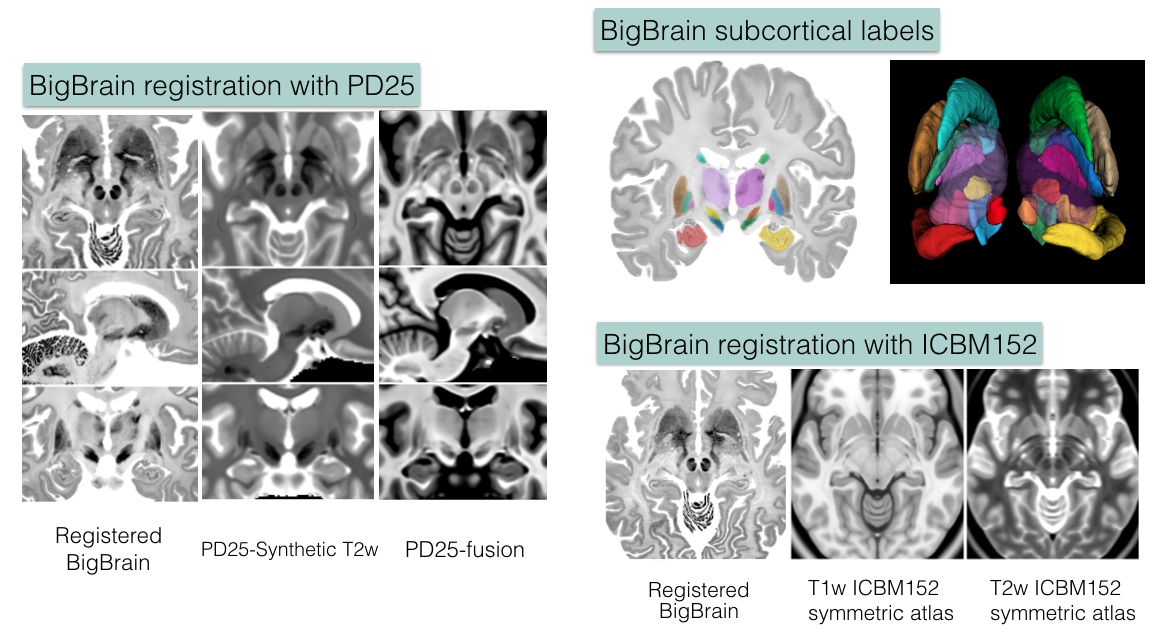
BigBrain co-registration
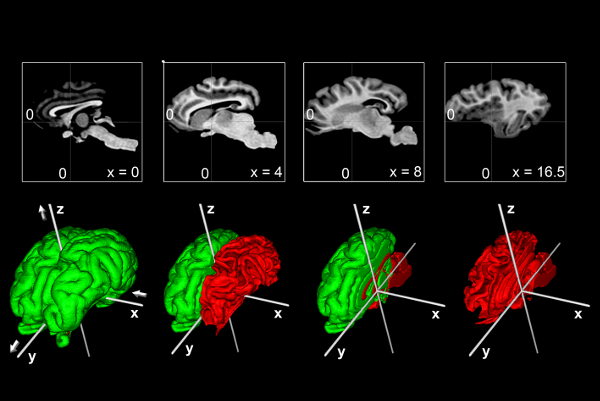
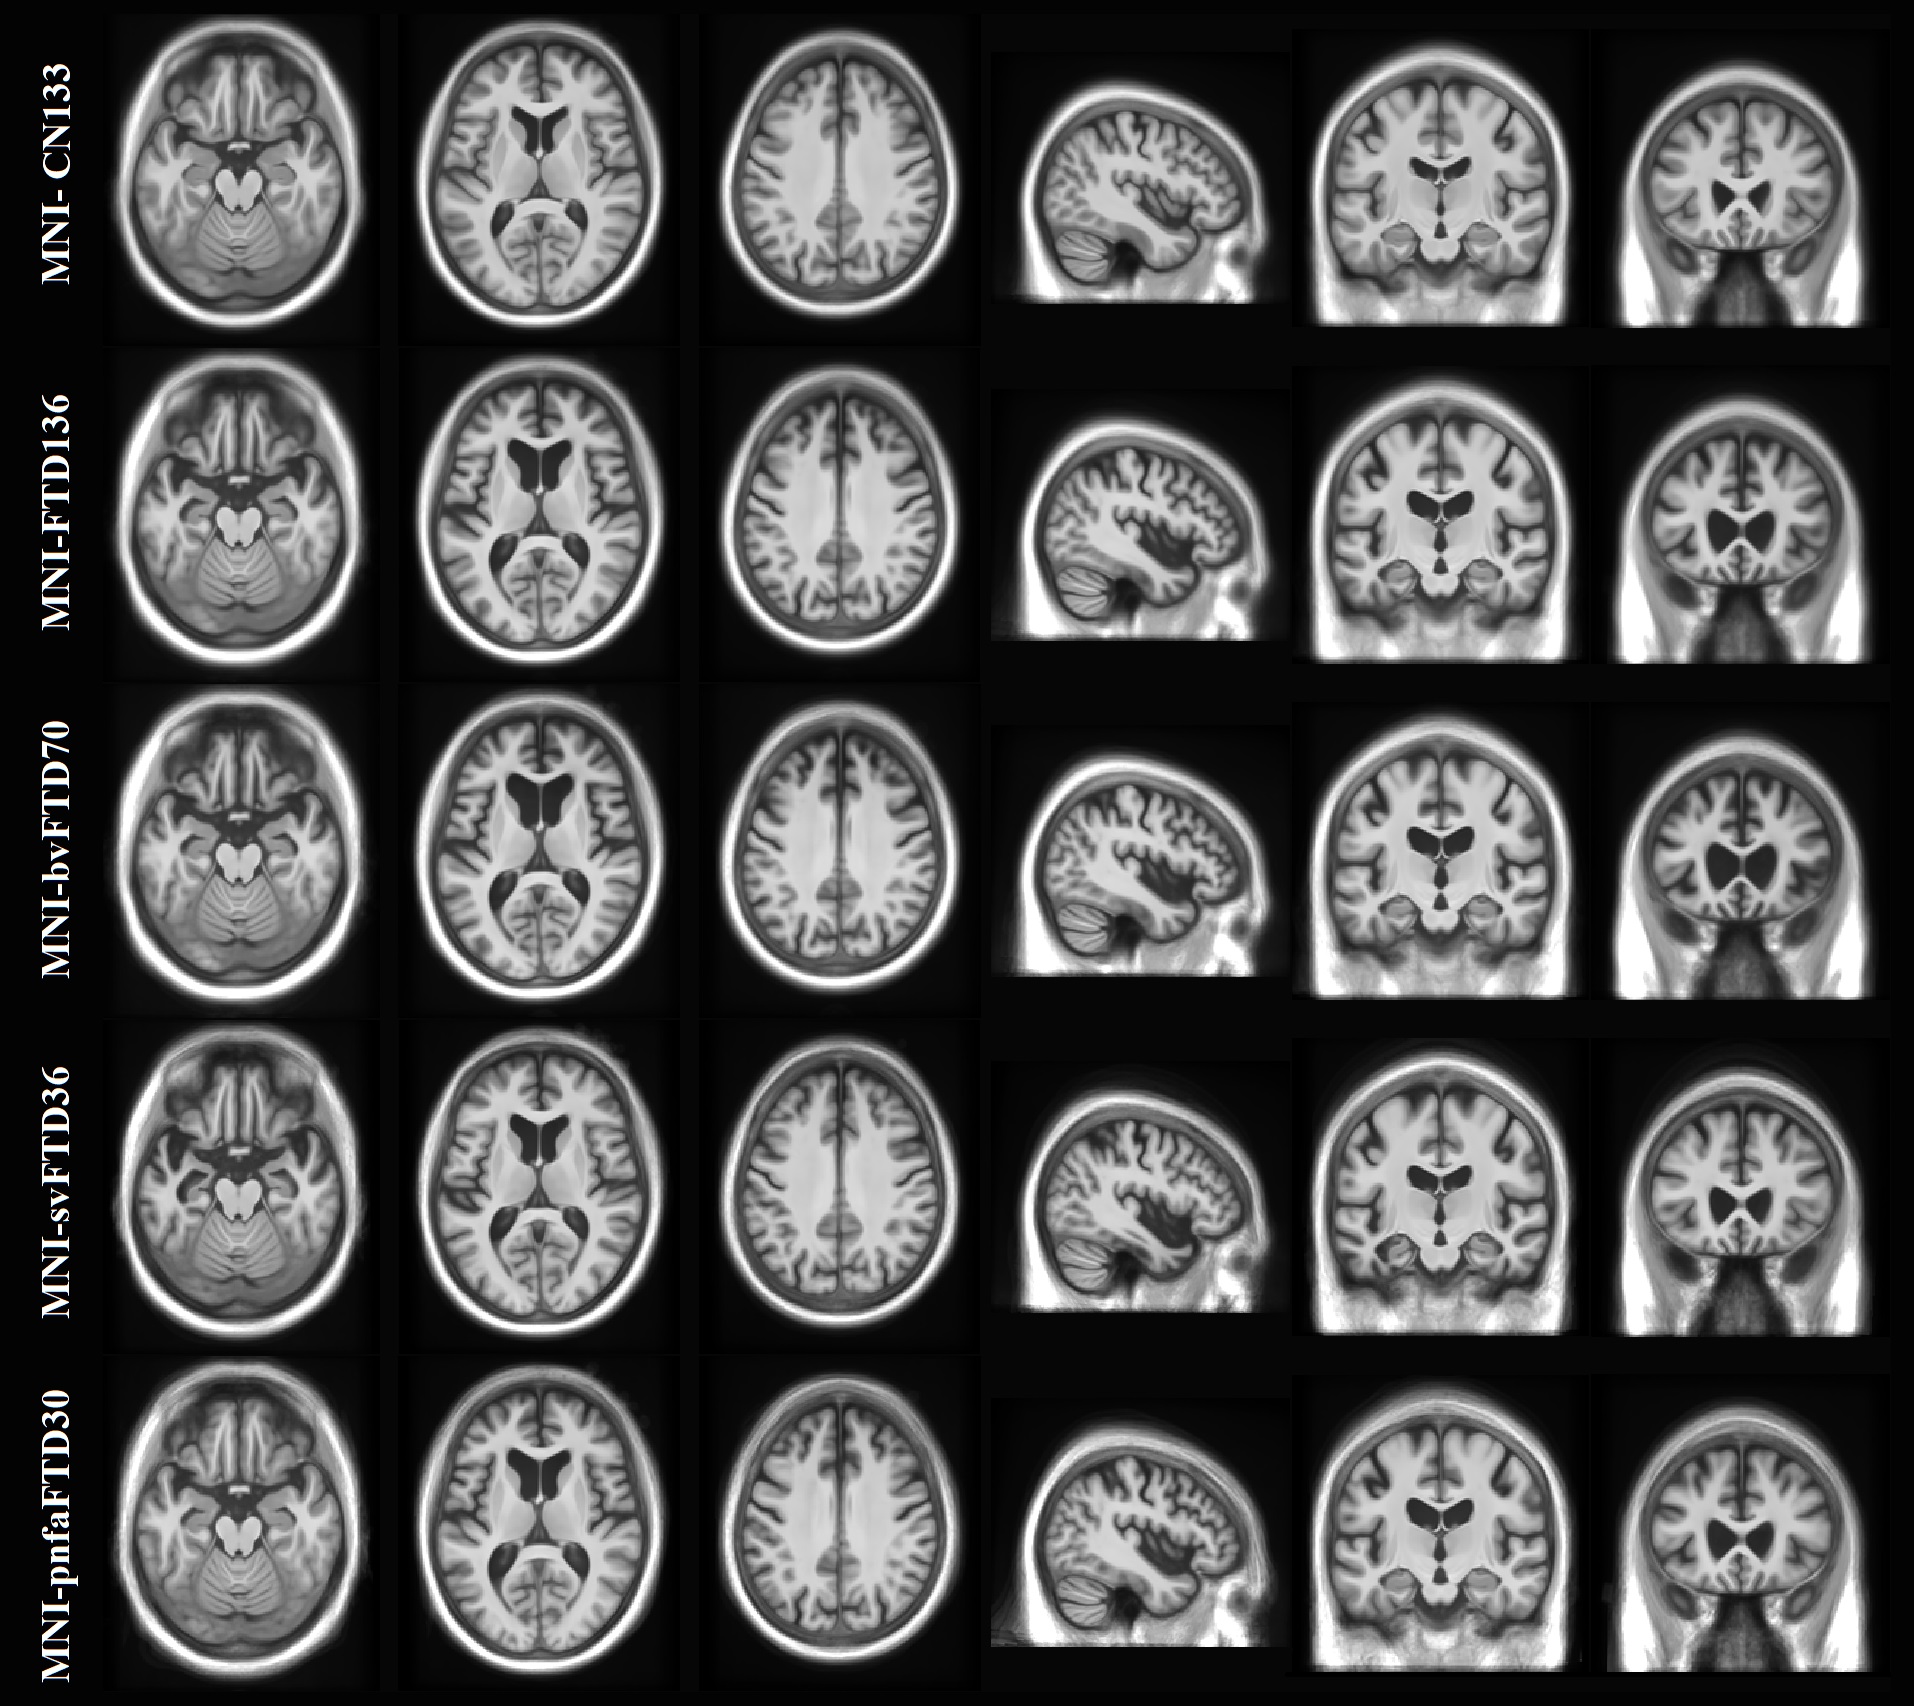
To help bridge the insights of micro and macro-levels of the brain, the
Big Brain atlas was nonlinearly registered to the PD25 and ICBM152 (symmetric and asymmetric) atlases in a multi-contrast registration strategy, and subcortical structures were manually segmented for BigBrain, PD25 , and ICBM152 atlases. To help relate PD25 atlas to clinical T2w MRI, a synthetic T2w PD25 atlas was also created. The registered BigBrain atlases are available at the resolutions of 1×1×1 mm, 0.5×0.5×0.5 mm, and 0.3×0.3×0.3 mm.
Data related to BigBrain co-registration:
1. Deformed BigBrain atlases:
- BigBrain in PD25 space: BigBrain-to-PD25-nonlin-{300um, 0.5mm, 1mm}
- BigBrain in ICBM152 symmetric atlas: BigBrain-to-ICBM2009sym-nonlin-{300um, 0.5mm, 1mm}
- BigBrain in ICBM152 asymmetric atlas: BigBrain-to-ICBM2009asym-nonlin-{300um, 0.5mm, 1mm}
- Synthetic T2w PD25 atlas: PD25-SynT2-template-{300um, 0.5mm, 1mm}
- T1-T2* fusion PD25 atlas: PD25-enhanceFusion-template-{300um, 0.5mm, 1mm}
2. Manual subcortical segmentations:
- BigBrain coregistered to ICBM in the BigBrain2015 release: BigBrain-segmentation-0.3mm
- MNI PD25: PD25-segmentation-0.5mm
- ICBM152 2009b symmetric: ICBM2009b_sym-segmentation-0.5mm
- ICMB152 2009b asymmetric: ICBM2009b_asym-segmentation-0.5mm
3. Related transformations:
- BiBrain-to-PD25: BigBrain-to-PD25-nonlin.xfm
- BigBrain-to-ICBM2009asym: BigBrain-to-ICBM2009asym-nonlin.xfm
- BigBrain-to-ICBM2009sym: BigBrain-to-ICBM2009sym-nonlin.xfm
- PD25-to-ICBM2009asym: PD25-to-ICBM2009asym-nonlin.xfm
- PD25-to-ICBM2009sym: PD25-to-ICBM2009sym-nonlin.xfm
4. List of subcortical labels: subcortical-labels.csv
Publications
For the methods used, and to use the atlas for research purposes, please cite the following articles:
- Y. Xiao, V. Fonov, S. Beriault, F.A. Subaie, M.M. Chakravarty, A.F. Sadikot, G. Bruce Pike, and D. Louis Collins, “A dataset of multi-contrast population-averaged brain MRI atlases of a Parkinson’s disease cohort,” accepted in Data in Brief, 2017.
- Y. Xiao, V. Fonov, S. Beriault, F.A. Subaie, M.M. Chakravarty, A.F. Sadikot, G. Bruce Pike, and D. Louis Collins, “Multi-contrast unbiased MRI atlas of a Parkinson’s disease population,” International Journal of Computer-Assisted Radiology and Surgery, vol. 10(3), pp. 329-341, 2015.
- Y. Xiao, S. Beriault, G. Bruce Pike, and D. Louis Collins, “Multicontrast multiecho FLASH MRI for targeting the subthalamic nucleus,” Magnetic Resonance Imaging, vol. 30, pp. 627-640, 2012.
If you are using the BigBrain atlas co-registration dataset, please refer to the following preprint:
- Y. Xiao, J.C. Lau, T. Anderson, J. DeKraker, D. Louis Collins, T. Peters, and A.R. Khan, “Bridging micro and macro: accurate registration of the BigBrain dataset with the MNI PD25 and ICBM152 atlases,” bioRxiv 561118; doi: https://doi.org/10.1101/561118.
If you are using the Big Brain data, please cite the following publication:
- Amunts, K. et al.: “BigBrain: An Ultrahigh-Resolution 3D Human Brain Model”, Science (2013) 340 no. 6139 1472-1475, June 2013
Copyright
Copyright (C) 2016,2017,2018 Yiming Xiao, McConnell Brain Imaging Centre,
Montreal Neurological Institute, McGill University.
License
PD25 atlases are distributed under CC BY-NC-SA 3.0 Licence
Dataset for BigBrain co-registration with PD25 and ICBM152 is under CC BY 4.0 Licence. Note that this exception to the existing BigBrain dataset does not alter the general term of the license for the use of BigBrain itself, which is still under CC BY-NC-SA 4.0 License.
Download
Version 20170213: Download archives containing brain atlases, brain masks, midbrain and subcortical segmentation and histological labels: MINC1, MINC2, NIFTI
Version 20160706: Download archives containing brain atlases, brain masks and midbrain segmentation: MINC1, MINC2, NIFTI
Co-registration of BigBrain with PD25 and ICBM152 atlases: Download archives containing registered Big Brain atlas, manual segmentations, and registration transformation (only available in MINC2 package): MINC2, NIFTI