Augmented Reality for Brain Tumour Surgery

Augmented reality (AR) visualization in image-guided neurosurgery (IGNS) allows a surgeon to see rendered preoperative medical datasets (e.g. MRI/CT) from a navigation system merged with the surgical field of view. Combining the real surgical scene with the virtual anatomical models into a comprehensive visualization has the potential of reducing the cognitive burden of the surgeon by removing the need to map preoperative images and surgical plans from the navigation system to the patient. Furthermore, it allows the surgeon to see beyond the visible surface of the patient, directly at the anatomy of interest, which may not be readily visible.


ar

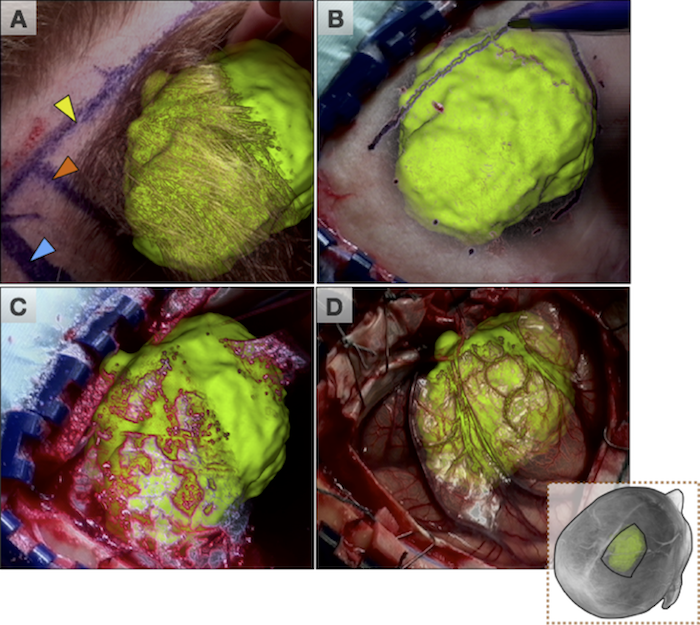
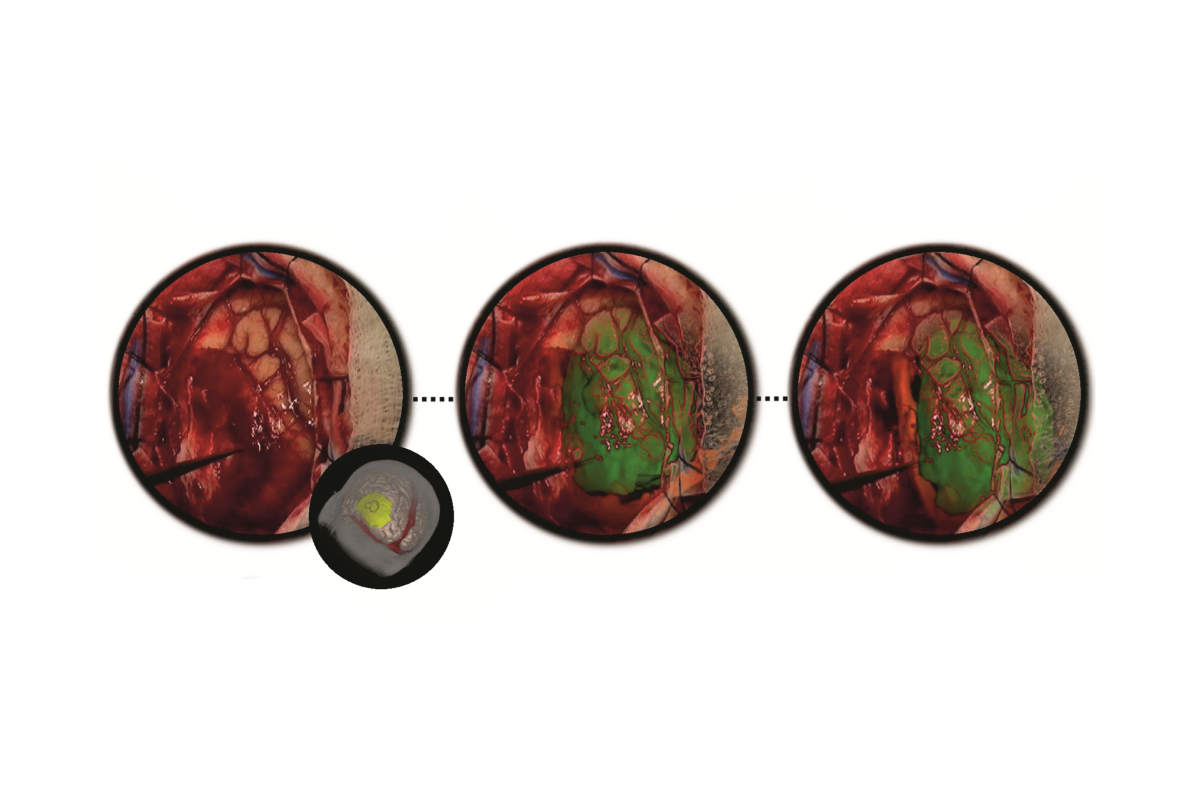
Figure: Augmented reality visualizations from our neuronavigation system. The surgeon used AR for craniotomy planning on the skin (A), the bone (B), the dura (C), and also after the craniotomy on the cortex (D). In A, the orange arrow indicated the posterior boundary of the tumour and the blue arrow indicates the planned posterior boundary of the craniotomy that will allow access to the tumour. The yellow arrow shows the medial extent of the tumour, which is also the planned craniotomy margin. In B, the surgeon uses the augmented reality view to trace around the tumour in order to determine the size of the bone flap to be removed. In C, AR is used prior to the opening of the dura and in D the tumour is visualized on the cortex prior to its resection.

Video

Publications

  1. M. Kersten-Oertel, I. J. Gerard , S. Drouin , J. A. Hall , D. L. Collins. “Intraoperative Craniotomy Planning for Brain Tumour Surgery using Augmented Reality”, to be presented at CARS 2016. 
  2. I. J. Gerard, M. Kersten-Oertel, S. Drouin, J. A. Hall, K. Petrecca, D. De Nigris, T. Arbel and D. L. Collins. (2016) “Improving Patient Specific Neurosurgical Models with Intraoperative Ultrasound and Augmented Reality Visualizations in a Neuronavigation Environment,” in 4th Workshop on Clinical Image-based Procedures: Translational Research in Medical Imaging, LNCS 9401, pp. 1–8.*** Best Paper
  3. Kersten-Oertel, M., Gerard, I. J., Drouin, S., Mok, K., Petrecca, K., & Collins, D. L. (2015) Augmented Reality for Brain Tumour Resections. Int J CARS, 10(1):S260.

MNI Average Brain (305 MRI)

MNI Average Brain (305 MRI) Stereotaxic Registration Model

mni305_linThis is a version of the MNI Average Brain (an average of 305 T1-weighted MRI scans, linearly transformed to Talairach space) specially adapted for use with the MNI Linear Registration Package (mni_reg).

Methods
In order to overcome the idiosyncrasies of using a single subject brain as a template, in the early 1990s Evans and colleagues introduced the concept of a statistical MRI atlas for brain mapping (Evans et al., 1992a,b, 1993). The MNI305 atlas was constructed in two steps.

First, anatomical landmarks were manually identified in T1-weighted MRI scans from young healthy subjects (239 males, 66 females, age 23.4 +/- 4.1 years). These landmarks were chosen from the Talairach and Tournoux atlas and thus the final aver- age and space approximated Talairach space. Landmarks from each subject were fitted together via least-squares linear regression that matched the resulting AC-PC line to the original Talairach and Tournoux atlas. This yielded a first-pass average T1-weighted MRI volume.

Second, each native MRI volume was automatically mapped to the manually-derived average MRI to reduce the impact of order effects, manual errors and to create a sharper average. The mapping was not performed according to Talairach’s piecewise linear model but used a whole-brain linear (9-parameter) image similarity residual (Collins et al., 1994). The resultant template is thus an approx- imation of the original Talairach space and the Z-coordinate is approximately +3.5 mm relative to the Talairach coordinate. This process resulted in the original MNI305 atlas that has sub- sequently defined the MNI space. Note that, under constraints of linear alignment, residual non-linear anatomical variability across subjects gives rise to a “virtual convolution” (Evans et al., 1993) that somewhat enlarges the template compared with most individual brains.

Publications

  1. Collins, D.L., Neelin, P., Peters, T.M., Evans, A.C., 1994. Automatic 3-D intersubject reg- istration of MR volumetric data in standardized Talairach space. J. Comput. Assist. Tomogr. 18 (2), 192–205.
  2. Evans, A.C., Collins, D.L., Milner, B., 1992a. An MRI-based stereotaxic atlas from 250 young normal subjects. Proc 22nd Annual Symposium, Society for Neuroscience, 18, p. 408.
  3. Evans, A.C., Marrett, S., Neelin, P., Collins, D.L., Worsley, K., Dai, W., Milot, S., Meyer, E., Bub, D., 1992b. Anatomical mapping of functional activation in stereotactic coordi- nate space. NeuroImage 1 (1), 43–63.
  4. Evans, A.C., Collins, D.L., Mills, S.R., Brown, E.D., Kelly, R.L., Peters, T.M., 1993. 3D statis- tical neuroanatomical models from 305 MRI volumes. Proc IEEE-Nuclear Science Symposium and Medical Imaging Conference, pp. 1813–1817.

License
Copyright (C) 1993–2009 Louis Collins, McConnell Brain Imaging Centre, Montreal Neurological Institute, McGill University. Permission to use, copy, modify, and distribute this software and its documentation for any purpose and without fee is hereby granted, provided that the above copyright notice appear in all copies. The authors and McGill University make no representations about the suitability of this software for any purpose. It is provided “as is” without express or implied warranty. The authors are not responsible for any data loss, equipment damage, property loss, or injury to subjects or patients resulting from the use or misuse of this software package.

Download
Download archives containing average t1w model, brain mask and head mask: MINC1 3.6MB MINC2 3.7MB NIFTI 4.8MB

Colin 27 Average Brain 2008

Colin 27 Average Brain, Stereotaxic Registration Model, high-resolution version 2008

mni_colin27_2008

The anatomical phantom is derived from T1, T2, PD-weighted images formed from the average of 27, 11 and 12 scans respectively, of the same normal subject. These volumes are defined at a 0.5mm isotropic voxel grid in Talairach space, with dimensions 362*434*362 (XxYxZ) and start coordinates −90,−126,−72 (x,y,z). A discrete phantom was created by storing the label of the most important fraction class at each voxel location

Publications

  1. Holmes CJ, Hoge R, Collins DL, Woods R, Toga AW, Evans AC. “Enhancement of MR images using registration for signal averaging.” J Comput Assist Tomogr. 1998 Mar-Apr;22(2):324–33. https://dx.doi.org/10.1097/00004728-199803000-00032
  2. B Aubert-Broche, AC Evans, and DL Collins, “A new improved version of the realistic digital brain phantom,” NeuroImage, vol. 32, no. 1, pp. 138–45, 2006. https://www.ncbi.nlm.nih.gov/pubmed/16750398

License
Copyright (C) 1993–2009 Louis Collins, McConnell Brain Imaging Centre, Montreal Neurological Institute, McGill University. Permission to use, copy, modify, and distribute this software and its documentation for any purpose and without fee is hereby granted, provided that the above copyright notice appear in all copies. The authors and McGill University make no representations about the suitability of this software for any purpose. It is provided “as is” without express or implied warranty. The authors are not responsible for any data loss, equipment damage, property loss, or injury to subjects or patients resulting from the use or misuse of this software package.

Download
Download archives containing average t1w, t2w and pdw scan, and discrete tissue classification: 1: Cerebro-spinal fluid, 2: Gray Matter, 3: White Matter, 4: Fat, 5: Muscles, 6: Skin and Muscles, 7: Skull, 9: Fat 2, 10: Dura, 11: Marrow, 12: Vessels
MINC1 222MB MINC2 223MB NIFTI 291MB

Fuzzy segmentation

mni_colin27_2008_fuzzy
Download
Download archives containing 12 volumetric fuzzy volumes that define the spatial distribution for different tissues where voxel intensity is proportional to the fraction of tissue within the voxel (the integral of all tissue components is equal to 1).
MINC1 54MB MINC2 57MB NIFTI 90MB

Colin 27 Average Brain 1998

Stereotaxic Registration Model, original 1998 version

mni_colin27_1998This is a stereotaxic average of 27 T1-weighted MRI scans of the same individual. In 1998, a new atlas with much higher definition than MNI305s was created at the MNI. One individual (CJH) was scanned 27 times and the images linearly registered to create an average with high SNR and structure definition (Holmes et al., 1998). This average was linearly registered to the average 305. Ironically, this dataset was not originally intended for use as a stereotaxic template but as the sub- strate for an ROI parcellation scheme to be used with ANIMAL non-linear spatial normalization (Collins et al., 1995), i.e. it was intended for the purpose of segmentation, NOT stereotaxy. As a single brain atlas, it did not capture anatomical variability and was, to some degree, a reversion to the Talairach approach.

However, the high definition proved too attractive to the community and, after non-linear mapping to fit the MNI305 space, it has been adopted by many groups as a stereotaxic template (e.g., AFNI, Cox,; Brainstorm, Tadel et al., 2011; SPM, Litvak et al., 2011; Fieldtrip, Oostenveld et al., 2011).

Methods

This average dataset was created in a two step process. First, each of the 27 T1-weighted scans were registered to stereotaxic space using the mritotal procedure and resampled onto a 1mm grid in stereotaxic space. All 27 scans were averaged together to create an initial average. This average volume was used as a target for the second phase of registration where each original T1-weighted MRI was re-registered in stereotaxic space. This procedure has the advantage of removing the small variance in intra-subject mapping in stereotaxic space associated with the use of a multi-subject average.

 Publications

Holmes CJ, Hoge R, Collins L, Woods R, Toga AW, Evans AC. “Enhancement of MR images using registration for signal averaging.” J Comput Assist Tomogr. 1998 Mar-Apr;22(2):324–33. https://dx.doi.org/10.1097/00004728-199803000-00032

 License
Copyright (C) 1993–2009 Louis Collins, McConnell Brain Imaging Centre, Montreal Neurological Institute, McGill University. Permission to use, copy, modify, and distribute this software and its documentation for any purpose and without fee is hereby granted, provided that the above copyright notice appear in all copies. The authors and McGill University make no representations about the suitability of this software for any purpose. It is provided “as is” without express or implied warranty. The authors are not responsible for any data loss, equipment damage, property loss, or injury to subjects or patients resulting from the use or misuse of this software package.

Download

Download archives containing average t1w scan, brain mask and head mask: MINC1 13MB MINC2 13MB NIFTI 24MB

ICBM 152 Nonlinear atlases (2009)

mni_icbm152_sym_09c_small

A number of unbiased non-linear averages of the MNI152 database have been generated that combines the attractions of both high-spatial resolution and signal-to-noise while not being subject to the vagaries of any single brain (Fonov et al., 2011). The procedure involved multiple iterations of a process where, at each iteration, individual native MRIs were non-linearly fitted to the average template from the previous iteration, beginning with the MNI152 linear template.

We present an unbiased standard magnetic resonance imaging template brain volume for normal population. These volumes were created using data from ICBM project.

6 different templates are available:

  • ICBM 2009a Nonlinear Symmetric – 1×1x1mm template which includes T1w,T2w,PDw modalities, also T2 relaxometry (T2 values calculated for each subject using single dual echo PD/T2 scan), and tissue probabilities maps. Also included lobe atlas used for ANIMAL+INSECT segmentation, brain mask, eye mask and face mask. Intensity inhomogeneity was performed using N3 version 1.10.1.
  • ICBM 2009a Nonlinear Asymmetric template – 1×1x1mm template which includes T1w,T2w,PDw modalities, and tissue probabilities maps. Intensity inhomogeneity was performed using N3 version 1.10.1. Also included brain mask, eye mask and face mask.
  • ICBM 2009b Nonlinear Symmetric – 0.5×0.5×0.5mm template which includes only T1w,T2w and PDw modalities.
  • ICBM 2009b Nonlinear Asymmetric – 0.5×0.5×0.5mm template which includes only T1w,T2w and PDw modalities.
  • ICBM 2009c Nonlinear Symmetric – 1×1x1mm template which includes T1w,T2w,PDw modalities, and tissue probabilities maps. Also included lobe atlas used for ANIMAL+INSECT segmentation, brain mask, eye mask and face mask. Intensity inhomogeneity was performed using N3 version 1.11. Sampling is different from 2009a template.
  • ICBM 2009c Nonlinear Asymmetric template – 1×1x1mm template which includes T1w,T2w,PDw modalities, and tissue probabilities maps. Intensity inhomogeneity was performed using N3 version 1.11 Also included brain mask, eye mask and face mask.Sampling is different from 2009a template.

All templates are describing the same anatomy, but sampling and or pre-processing is different: different versions of N3 algorithm produces slightly different tissue probability maps. Tools for using these atlases can be found in the Software section.

 New: CerebrA: Mindboggle atlas adapted for ICBM 2009c template

  • CerebrA labels are based on an accurate non-linear registration of cortical and subcortical labelling from Mindboggle 101 to the symmetric ICBM 2009c atlas, followed by manual editing.

Viewing
Viewing the multiple atlas volumes online requires Java browser support. The Java Internet Viewer (JIV2) used here is available for download and personal use under the GNU general public license (GPL). To view the ICBM 2009 atlases online Click “View with JIV” links below. The MNI stereotaxic coordinates (X,Y,Z) are displayed in the first row below the volumes.

For viewing, one can use the left most mouse button to click on any image, and the other cross-sectional images will be updated with the appropriate position. You can also hold the middle/rocker mouse button down while moving up or down, to pan through the image plane. Holding ‘Shift’ with the left or middle button will enable dragging and zooming.

When looking at the images, remember that left is left and right is right!

 
Methods
Image pre-processing included non-uniform intensity correction (Sled, 1998) and intensity normalization to a range of 0–100. All T1w MRI data was then transformed into the Talairach-like MNI stereotaxic space using minctracc (Collins, Neelin et al. 1994). Brain masking was performed using BET (Smith, 2002). Age-based subgroups of subjects were created, and all scans within each group were then automatically re-registered to the stereotaxic space using the appropriate template. For each group, an iterative nonlinear co-registration algorithm (Grabner, Janke et al. 2006, Fonov, 2011), was applied to obtain the group averages. The T1-based transformation was then applied to the T2, PD and tissue classified volumes to generate average atlases for these data. Methodological details can be found in (Fonov, 2011).  
 
Anatomical Structures Segmentation
All necessary files are distributed with MINC1 and MINC2 versions of the 2009a and 2009c templates, use lobe_segment.pl script, it is also distributed as part of Minc Tool Kit

Software used to create average anatomical templates is available at Github, numerical identifiers of structures are explained in icbm2009_lobe_defs.txt

Demographics (same as ICBM152_linear)

  • Handedness was scored on a scale of 0-10.  Average(std dev) for 141 of the 152 subjects was 8.57(2.50) with a range of 1-10 and interquartile range 8-10.
  • Age, measured in years:  25.02(4.90)y, range 18-44y, interquartile range 21-28y
  • 86 males and 66 females
  • Ethnic background: 129 caucasian, 15 asian and 1 mixed decent

Publications

The following publications should be referenced when using this atlas:
  1. VS Fonov, AC Evans, K Botteron, CR Almli, RC McKinstry, DL Collins and BDCG, Unbiased average age-appropriate atlases for pediatric studies, NeuroImage,Volume 54, Issue 1, January 2011, ISSN 1053–8119, DOI: 10.1016/j.neuroimage.2010.07.033
  2. VS Fonov, AC Evans, RC McKinstry, CR Almli and DL Collins, Unbiased nonlinear average age-appropriate brain templates from birth to adulthood, NeuroImage, Volume 47, Supplement 1, July 2009, Page S102 Organization for Human Brain Mapping 2009 Annual Meeting, DOI: https://dx.doi.org/10.1016/S1053-8119(09)70884-5

Anatomical Structures Segmentation

  1. DL Collins, AP Zijdenbos, WFC Baaré and AC Evans, ANIMAL+INSECT: Improved Cortical Structure Segmentation,IPMI Lecture Notes in Computer Science, 1999, Volume 1613/1999, 210–223, DOI: https://dx.doi.org/10.1007/3-540-48714-X_16
CerebrA: Mindboggle atlas adapted for ICBM 2009c template
  1. AL Manera; M Dadar, VS Fonov, DL Collins, CerebrA: Accurate registration and manual label correction of the Mindboggle 101 atlas for the MNI-ICBM152 template. In press
License
Copyright (C) 1993–2004 Louis Collins, McConnell Brain Imaging Centre, Montreal Neurological Institute, McGill University. Permission to use, copy, modify, and distribute this software and its documentation for any purpose and without fee is hereby granted, provided that the above copyright notice appear in all copies. The authors and McGill University make no representations about the suitability of this software for any purpose. It is provided “as is” without express or implied warranty. The authors are not responsible for any data loss, equipment damage, property loss, or injury to subjects or patients resulting from the use or misuse of this software package.
Download
ICBM 2009a Nonlinear Symmetric
1×1x1mm template: MINC2 72MB MINC1 75MB NIFTI 56MB View with JIV
mni_icbm152_sym_09a_small
ICBM 2009a Nonlinear Asymmetric
1×1x1mm template: MINC2 58MB MINC1 58MB NIFTI 57MB
mni_icbm152_asym_09a_small
ICBM 2009b Nonlinear Symmetric
0.5×0.5×0.5mm template:MINC2 357MB MINC1 358MB NIFTI 348MB
mni_icbm152_sym_09b_small
ICBM 2009b Nonlinear Asymmetric
0.5×0.5×0.5mm template: MINC2 366MB MINC1 367MB NIFTI 358MB
mni_icbm152_asym_09b_small
ICBM 2009c Nonlinear Symmetric
1×1x1mm template: MINC2 57MB MINC1 57MB NIFTI 55MB View with JIV
mni_icbm152_sym_09c_small
ICBM 2009c Nonlinear Asymmetric
1×1x1mm template: MINC2 57MB MINC1 57MB NIFTI 57MB
mni_icbm152_asym_09c_small
CerebrA atlas
MINC2 MINC1 NIFTI
mni_icbm152_nlin_sym_09c_CerebrA
Contact
For questions related to the MNI ICBM 2009 atlases (rather than the website), contact Vladimir Fonov

MNI ICBM152 non-linear

MNI ICBM 152 non-linear 6th Generation Symmetric Average Brain Stereotaxic Registration Model

This is a version of the ICBM Average Brain – an average of 152 T1-weighted MRI scans, linearly and non-linearly (6 iterations) transformed to form a symmetric model in Talairach space – that is specially adapted for use with the MNI Linear Registration Package (mni_autoreg).

Publications

  1. G. Grabner, A. L. Janke, M. M. Budge, D. Smith, J. Pruessner, and D. L. Collins, “Symmetric atlasing and model based segmentation: an application to the hippocampus in older adults”, Med Image Comput Comput Assist Interv Int Conf Med Image Comput Comput Assist Interv, vol. 9, pp. 58–66, 2006. https://dx.doi.org/10.1007/11866763_8

License
Copyright (C) 1993–2009 Louis Collins, McConnell Brain Imaging Centre, Montreal Neurological Institute, McGill University. Permission to use, copy, modify, and distribute this software and its documentation for any purpose and without fee is hereby granted, provided that the above copyright notice appear in all copies. The authors and McGill University make no representations about the suitability of this software for any purpose. It is provided “as is” without express or implied warranty. The authors are not responsible for any data loss, equipment damage, property loss, or injury to subjects or patients resulting from the use or misuse of this software package.

Download
Download archives containing average t1w model, brain mask, head mask and eye mask: MINC1 11MB MINC2 11MB NIFTI 13MB

Linear ICBM Average Brain (ICBM152) Stereotaxic Registration Model

mni_icbm152_lin
This is a version of the ICBM Average Brain – an average of 152 T1-weighted MRI scans, linearly transformed to Talairach space – that is specially adapted for use with the MNI Linear Registration Package (mni_autoreg).

Methods

In 2001, within the ICBM project (Mazziotta et al., 1995, 2001a,b), three sites (MNI, UCLA, UTHSCSA) each collected ~150 MRI volume images from a normative young adult population. These images were acquired at a higher resolution than the MNI305 data and exhibited improved contrast. To create MNI152, each individual in the MNI cohort was linearly registered to MNI305. This new template exhibits better contrast and better definition of the top of the brain and the bottom of the cerebellum due to the increased cover- age during acquisition.

Demographics

  • Handedness was scored on a scale of 0-10.  Average(std dev) for 141 of the 152 subjects was 8.57(2.50) with a range of 1-10 and interquartile range 8-10.
  • Age, measured in years:  25.02(4.90)y, range 18-44y, interquartile range 21-28y
  • 86 males and 66 females
  • Ethnic background: 129 caucasian, 15 asian and 1 mixed decent

Publications

Mazziotta, J.C., Toga, A.W., Evans, A.C., Fox, P., Lancaster, J., 1995. A probabilistic atlas of the human brain: theory and rationale for its development. NeuroImage 2, 89–101. Mazziotta, J.A., Toga, A.W.,

Evans, A.C., Fox, P.T., Lancaster, J., Zilles, K., Woods, R., Paus, T., Simpson, G., Pike, B., Holmes, C., Collins, D.L., Thompson, P., MacDonald, D., Iacoboni, M., Schormann, T., Amunts, K., Palomero-Gallagher, N., Geyer, S., Parsons, L., Narr, K., Kabani, N., LeGoualher, G., Boomsma, D., Cannon, T., Kawashima, R., Mazoyer, B., 2001a. A probabilistic atlas and reference system for the human brain: International Consortium for Brain Mapping (ICBM). Philos. Trans. R. Soc. London B Biol. Sci. 356, 1293–1322.

Mazziotta, J.C., Toga, A.W., Evans, A.C., Fox, P.T., Lancaster, J., Zilles, K., Woods, R., Paus, T., Simpson, G., Pike, B., Holmes, C.J., Collins, D.L., Thompson, P., MacDonald, D., Iacoboni, M., Schormann, T., Amunts, K., Palomero-Gallagher, N., Geyer, S., Parson, L., Narr, K., Kabani, N., LeGoualher, G., Boomsma, D., Cannon, T., Kawashima, R., Mazoyer, B., International Consortium for Brain Mapping, 2001b. Four-dimensional probabilistic atlas of the human brain. J. Am. Med. Inform. Assoc. (JAMIA) 8 (5), 401–430 https://www.loni.ucla.edu/ICBM/Downloads/Downloads_ICBMtemplate. shtml.

License

Copyright (C) 1993–2009 Louis Collins, McConnell Brain Imaging Centre, Montreal Neurological Institute, McGill University. Permission to use, copy, modify, and distribute this software and its documentation for any purpose and without fee is hereby granted, provided that the above copyright notice appear in all copies. The authors and McGill University make no representations about the suitability of this software for any purpose. It is provided “as is” without express or implied warranty. The authors are not responsible for any data loss, equipment damage, property loss, or injury to subjects or patients resulting from the use or misuse of this software package.

Download

Download archives containing average t1w,t2w and pdw model, brain mask and head mask: MINC1 30MB MINC2 30MB NIFTI 41MB

Augmented Reality Vessel Visualization

We explored a number of different volume rendering methods for AR visualization of vessel topology and blood flow.

Publications

  1. M. Kersten-Oertel, S. Drouin, S. J. S. Chen, D. L. Collins. ‘ “Volume Visualization for Neurovascular Augmented Reality Surgery”. Augmented Reality Environments for Medical Imaging and Computer-Assisted Interventions. Lecture Notes in Computer Science Volume 8090, pp 211–220, 2013.
  2. M. Kersten-Oertel, S.J.S Chen, S. Drouin, D. Sinclair, D. L. Collins. “Augmented Reality Visualization for Guidance in Neurovascular Surgery.” Stud Health Technol Inform 173:225–9. Proceedings of Medicine Meets Virtual Reality (MMVR), New Port, CA, Feb 9–11, 2012.
  3. S. Drouin, M. Kersten-Oertel, S. J. S. Chen, D. L. Collins. “A Realistic Test and Development Environmentfor Mixed Reality in Neurosurgery”. Augmented Environments for Computer Assisted Interventions’ (Proceedings of MICCAI AE-CAI Workshop 2011) Lecture Notes in Computer Science, Volume 7264:13–23, 2012.

Visualizing Blood Flow

Cerebral arteriovenous malformations (AVMs) are a type of vascular anomaly consisting of large intertwined vascular growth (the nidus) that are prone to serious hemorrhaging and can result in patient death if left untreated. Intervention through surgical clipping of feeding and draining vessels to the nidus is a common treatment. However, identification of which vessels to clip is challenging even to experienced surgeons aided by conventional image guidance systems. In this work, we describe our methods for processing static preoperative angiographic images in order to effectively visualize the feeding and draining vessels of an AVM nidus. Maps from level-set front propagation processing of the vessel images are used to label the vessels by colour. Furthermore, images are decluttered using the topological distances between vessels. In order to aid the surgeon in the vessel clipping decision-making process during surgery, the results are displayed to the surgeon using augmented virtuality.

Decluttering and visualizing blood flow

Publications

  1. S. J. S. Chen, M. Kersten-Oertel, S. Drouin, and D. L. Collins. “Visualizing the path of blood flow for image guided surgery of cerebral arteriovenous malformations”. SPIE Medical Imaging, San Diego, CA, Feb 4–9, 2012.
  2. M. Kersten-Oertel, S. J. S. Chen, D. L. Collins. “Enhancing depth perception of volume-rendered angiography data”.VIS 2011 Poster Session, Providence, RI, Oct. 23–38, 2011.

Visualizing Vascular Volumes

Cerebral vascular images obtained through angiography are used by neurosurgeons for diagnosis, surgical planning and intra-operative guidance. The intricate branching of the vessels and furcations, however, make the task of understanding the spatial three-dimensional layout of these mages challenging. In this paper, we present empirical studies on the effect of different perceptual cues (fog, pseudo-chromadepth, kinetic depth, and depicting edges) both individually and in combination on the depth perception of cerebral vascular volumes and compare these to the cue of stereopsis. Two experiments with novices and one experiment with experts were performed. The results with novices showed that the pseudo-chromadepth and fog cues were stronger cues than that of stereopsis. Furthermore, the addition of the stereopsis cue to the other cues did not improve relative depth perception in cerebral vascular volumes. In contrast to novices, the experts also performed well with the edge cue. In terms of both novice and expert subjects, pseudo-chromadepth and fog allow for the best relative depth perception, although experts unlike novices also performed well with the edge cue. By using such cues to improve depth perception of cerebral vasculature we may improve diagnosis, surgical planning, and intra-operative guidance.

Publications

  1.  Marta Kersten-Oertel, S. J. S. Chen, D. Louis Collins. An Evaluation of Depth Enhancing Perceptual Cues for Vascular Volume Visualization in Neurosurgery. IEEE Trans Vis Comput Graph. March, 2014.
  2.  M. Kersten-Oertel, S. J. S. Chen, D. L. Collins. “A Comparison of Depth Enhancing Perceptual Cues for Vessel Visualization in Neurosurgery.” CARS, June 27–30, 2012.
YouTube-logo-full_color